

Power BI
Create a data-driven culture with BI for all
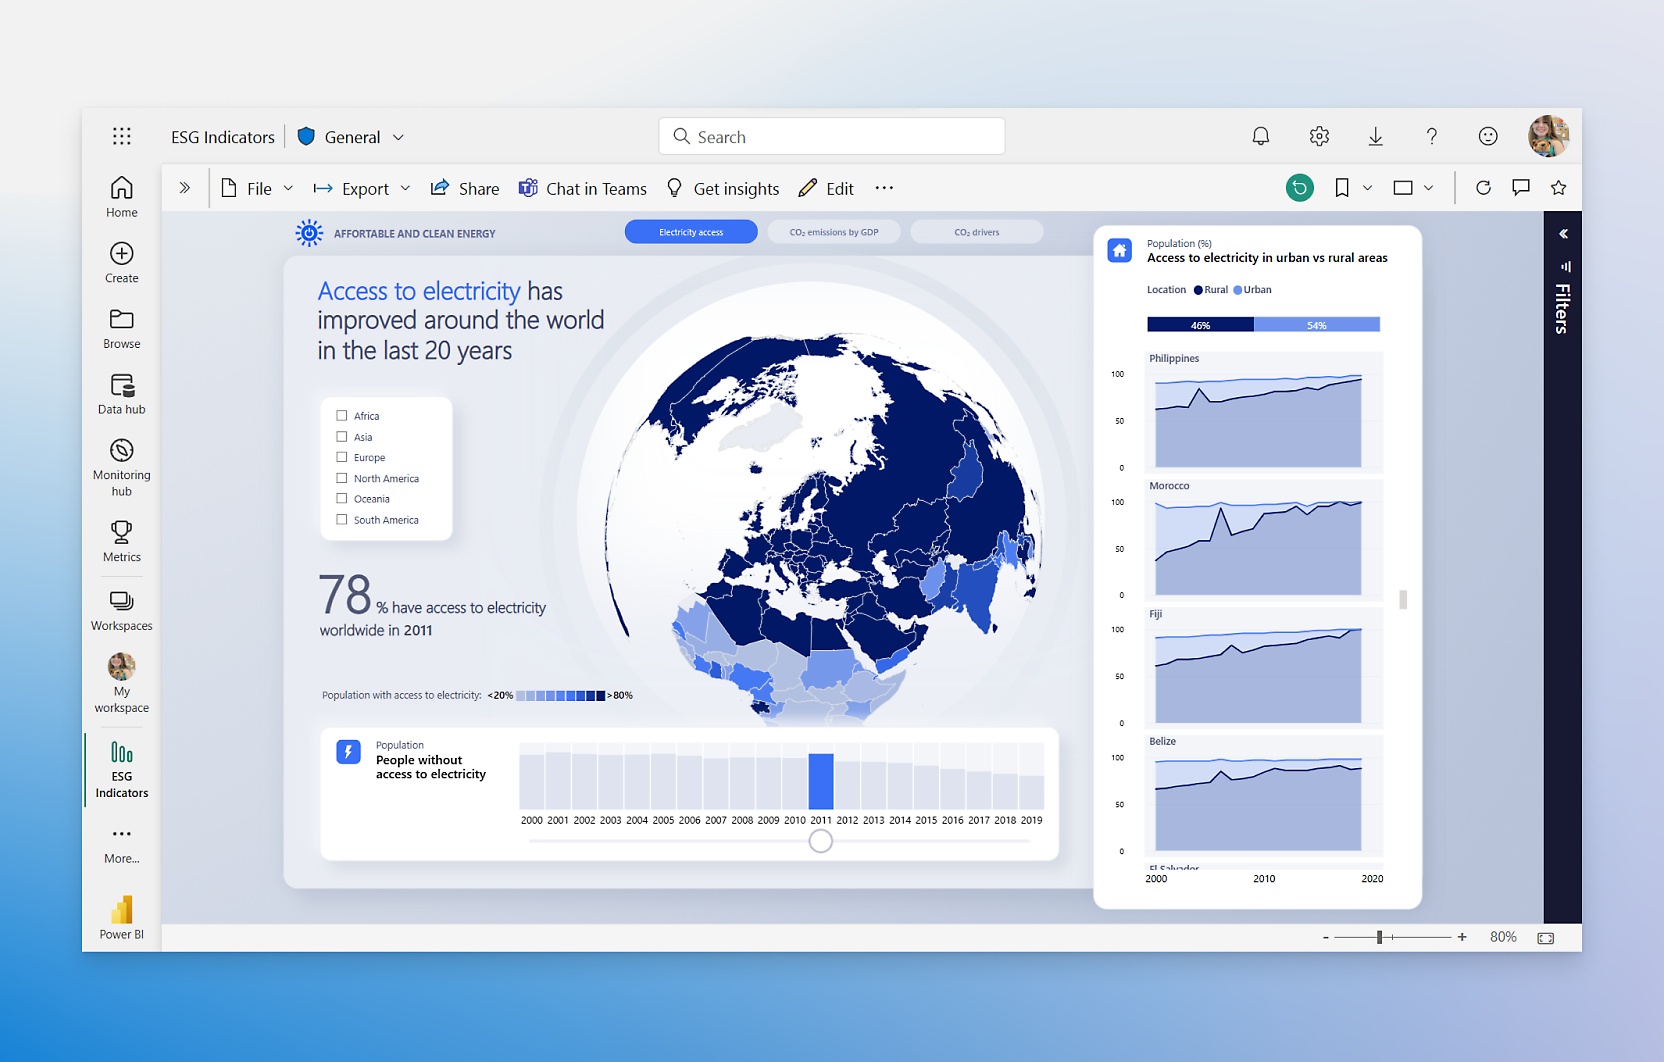
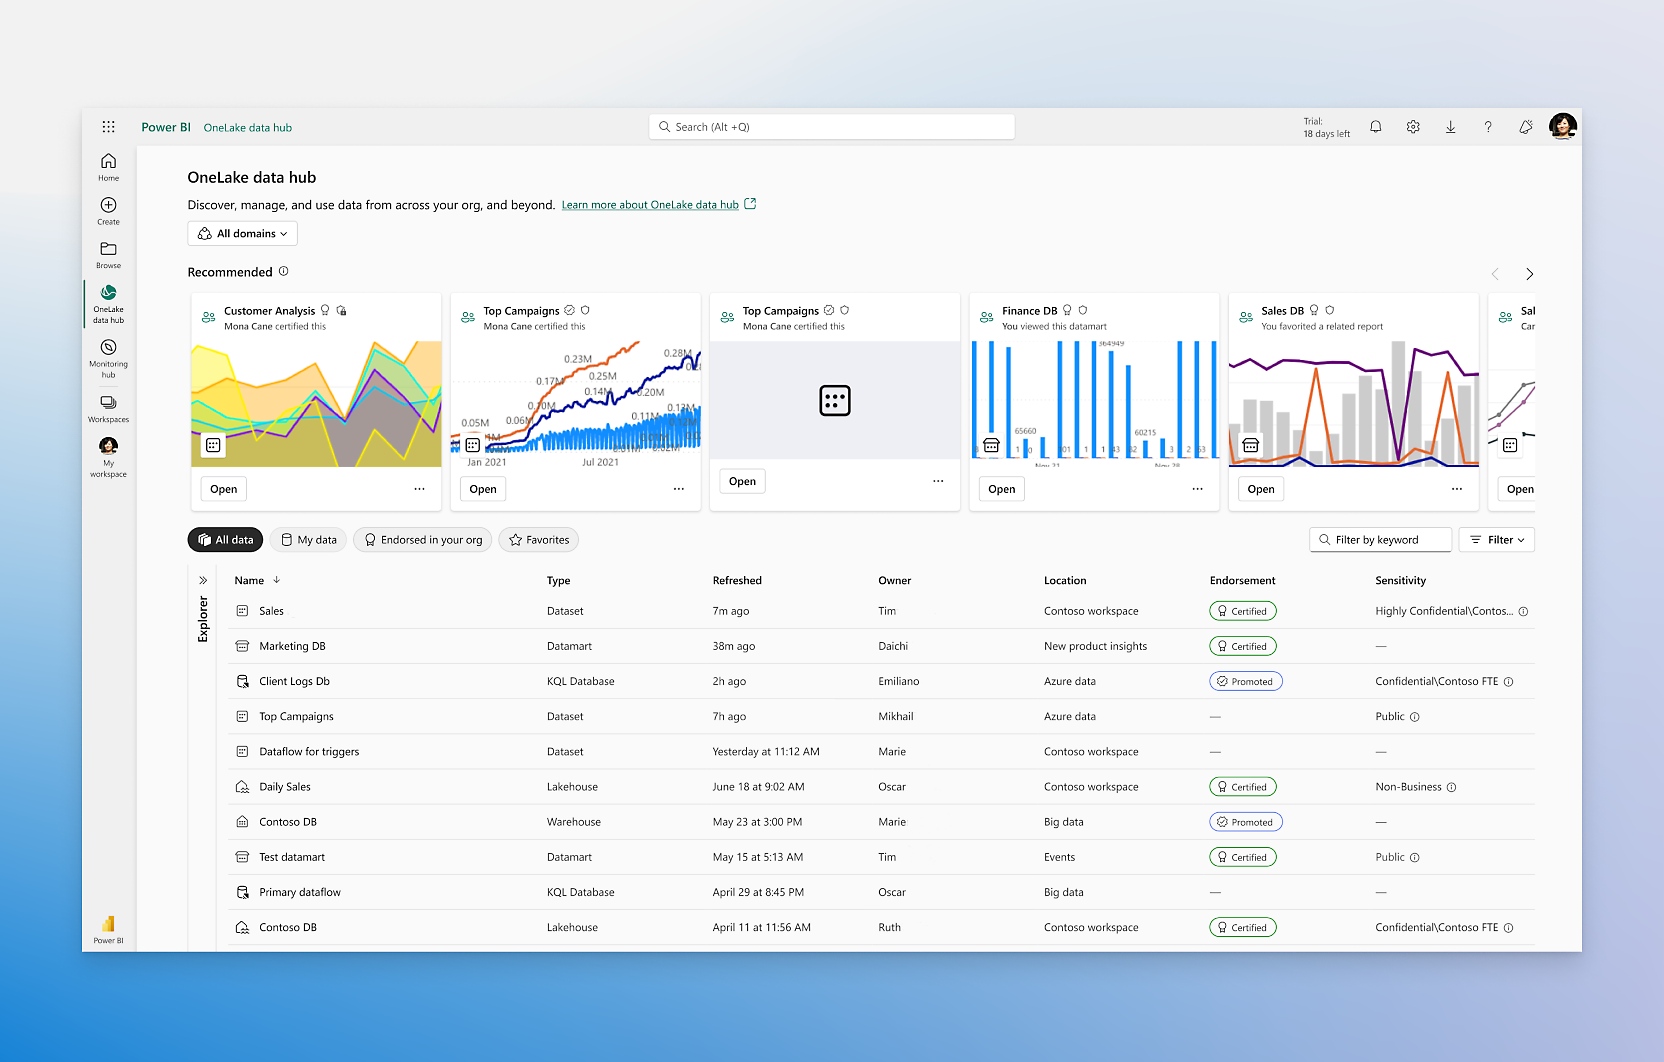
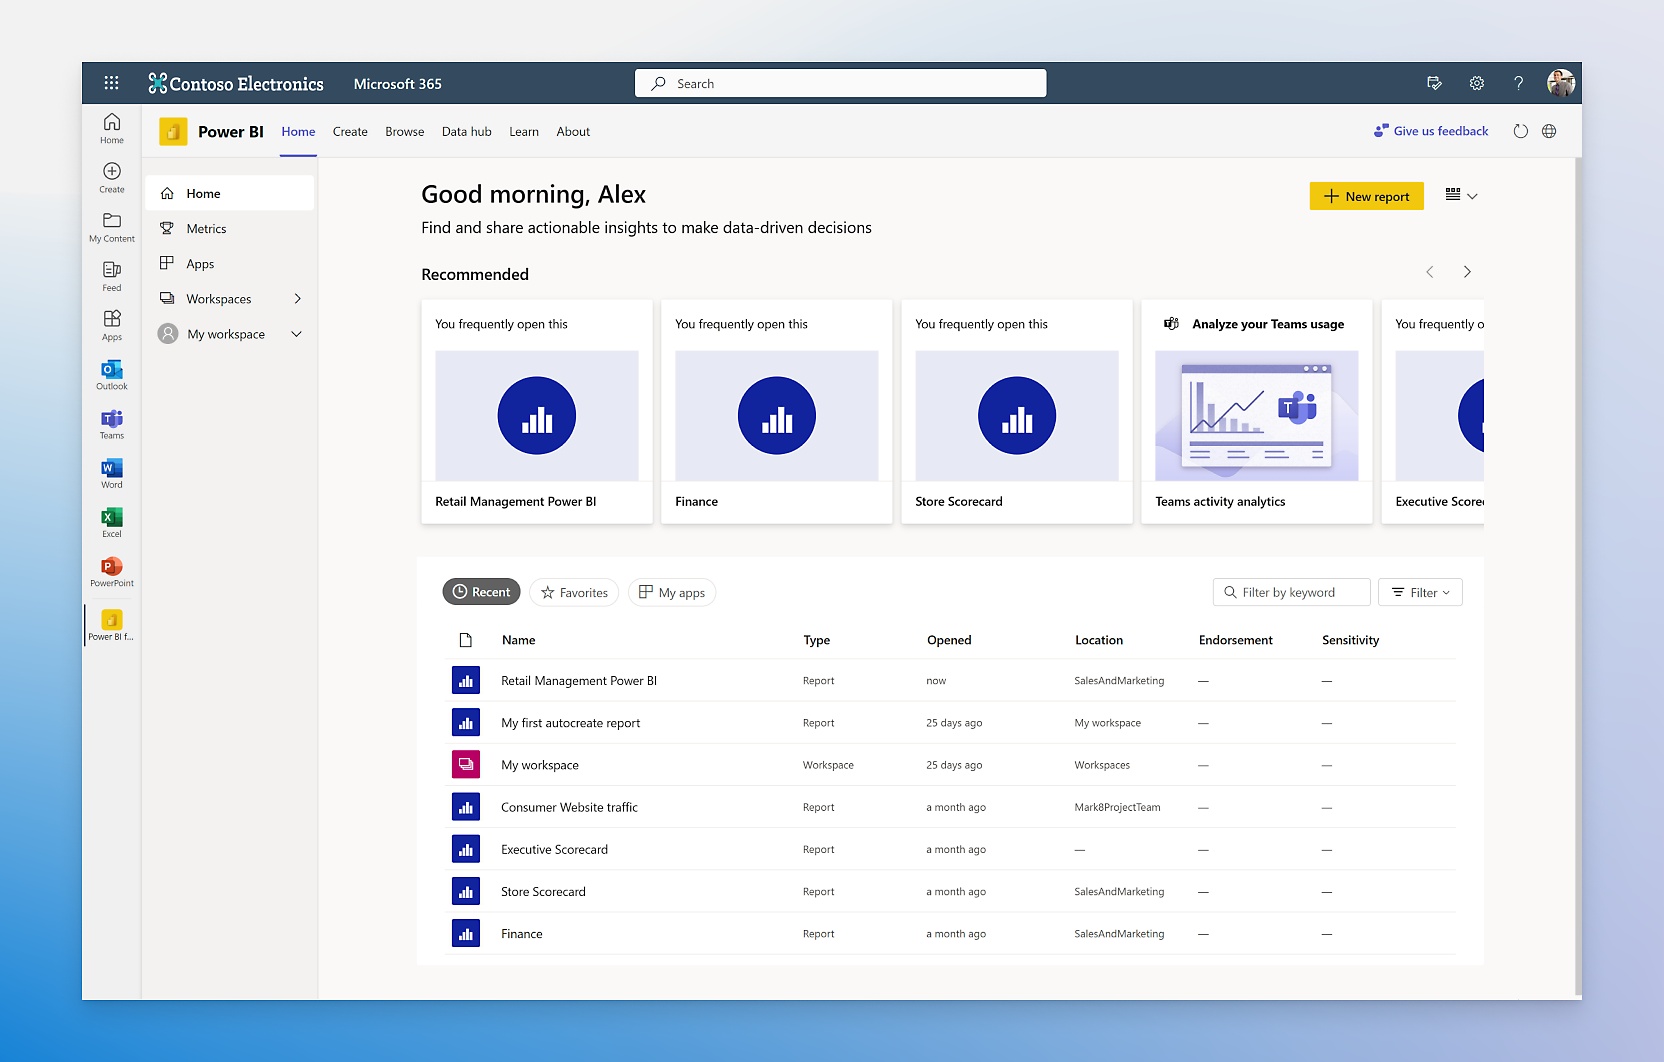
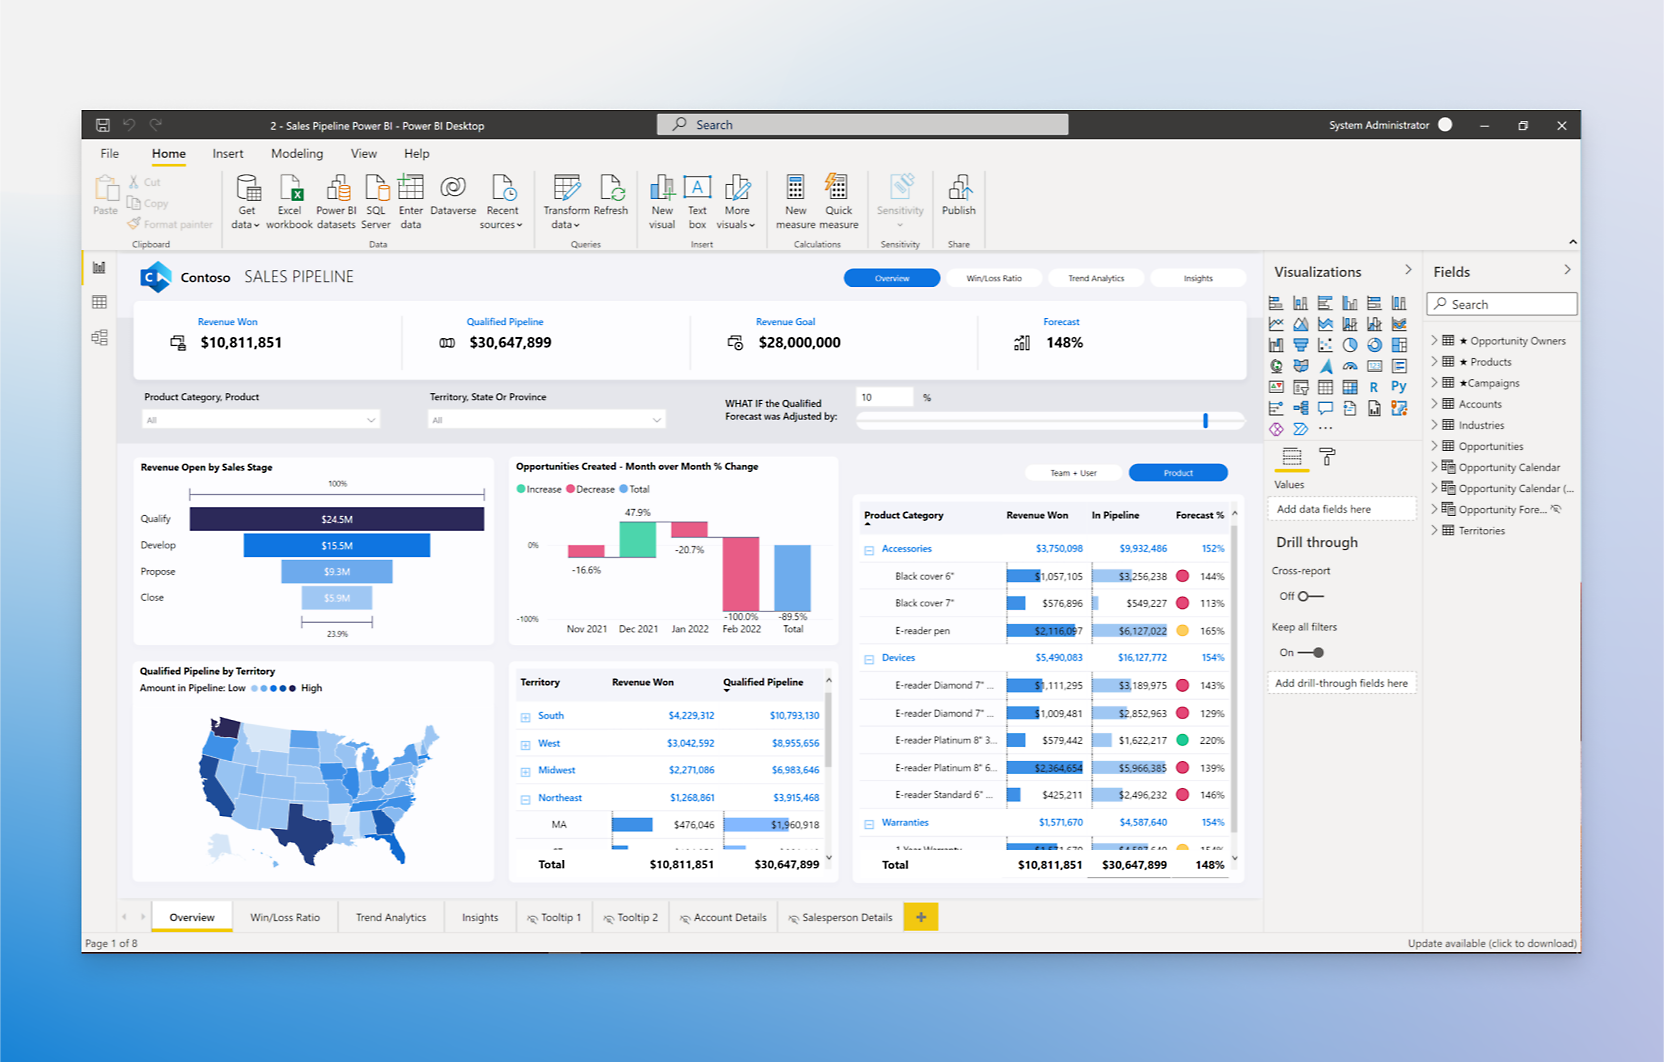
- Turn your data into visuals with advanced data-analysis tools, AI capabilities, and a user-friendly report-creation tool.Create datasets from any source and add them to the OneLake data hub to create a source of truth for your data.Help users make better decisions by infusing insights into the apps you use every day, like those in Microsoft 365.Reshape how your organization accesses, manages, and acts on data by activating Microsoft Fabric in your Power BI experience.
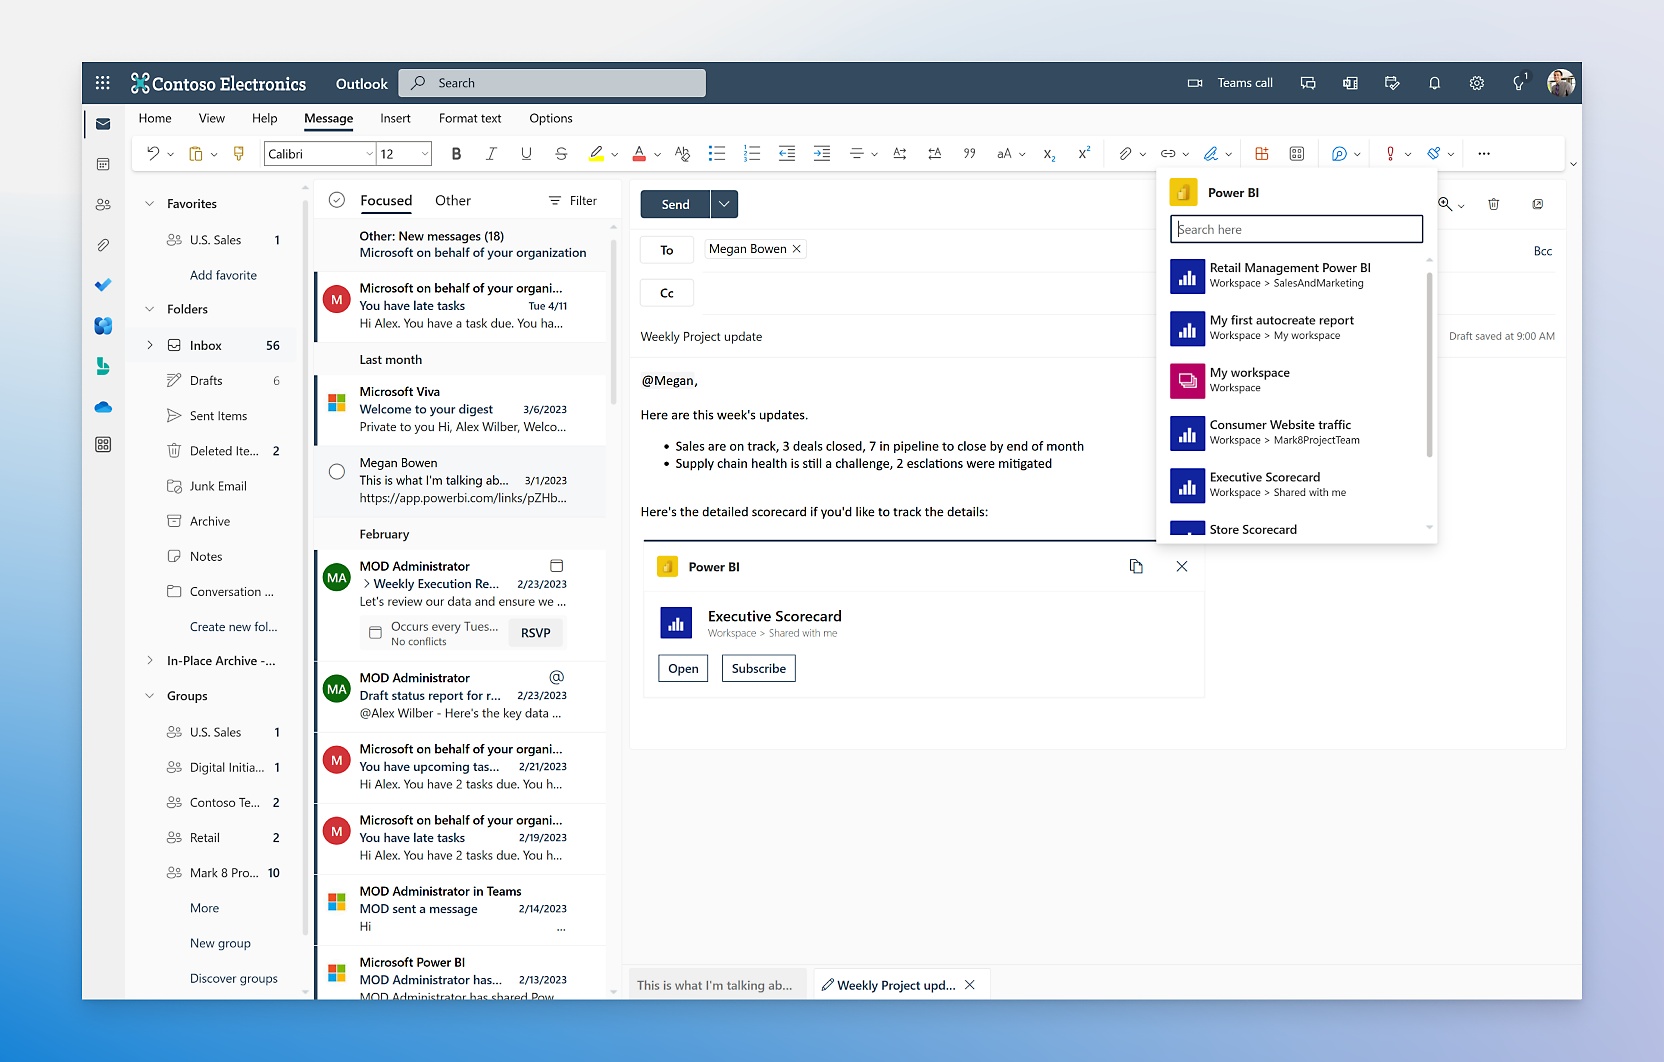
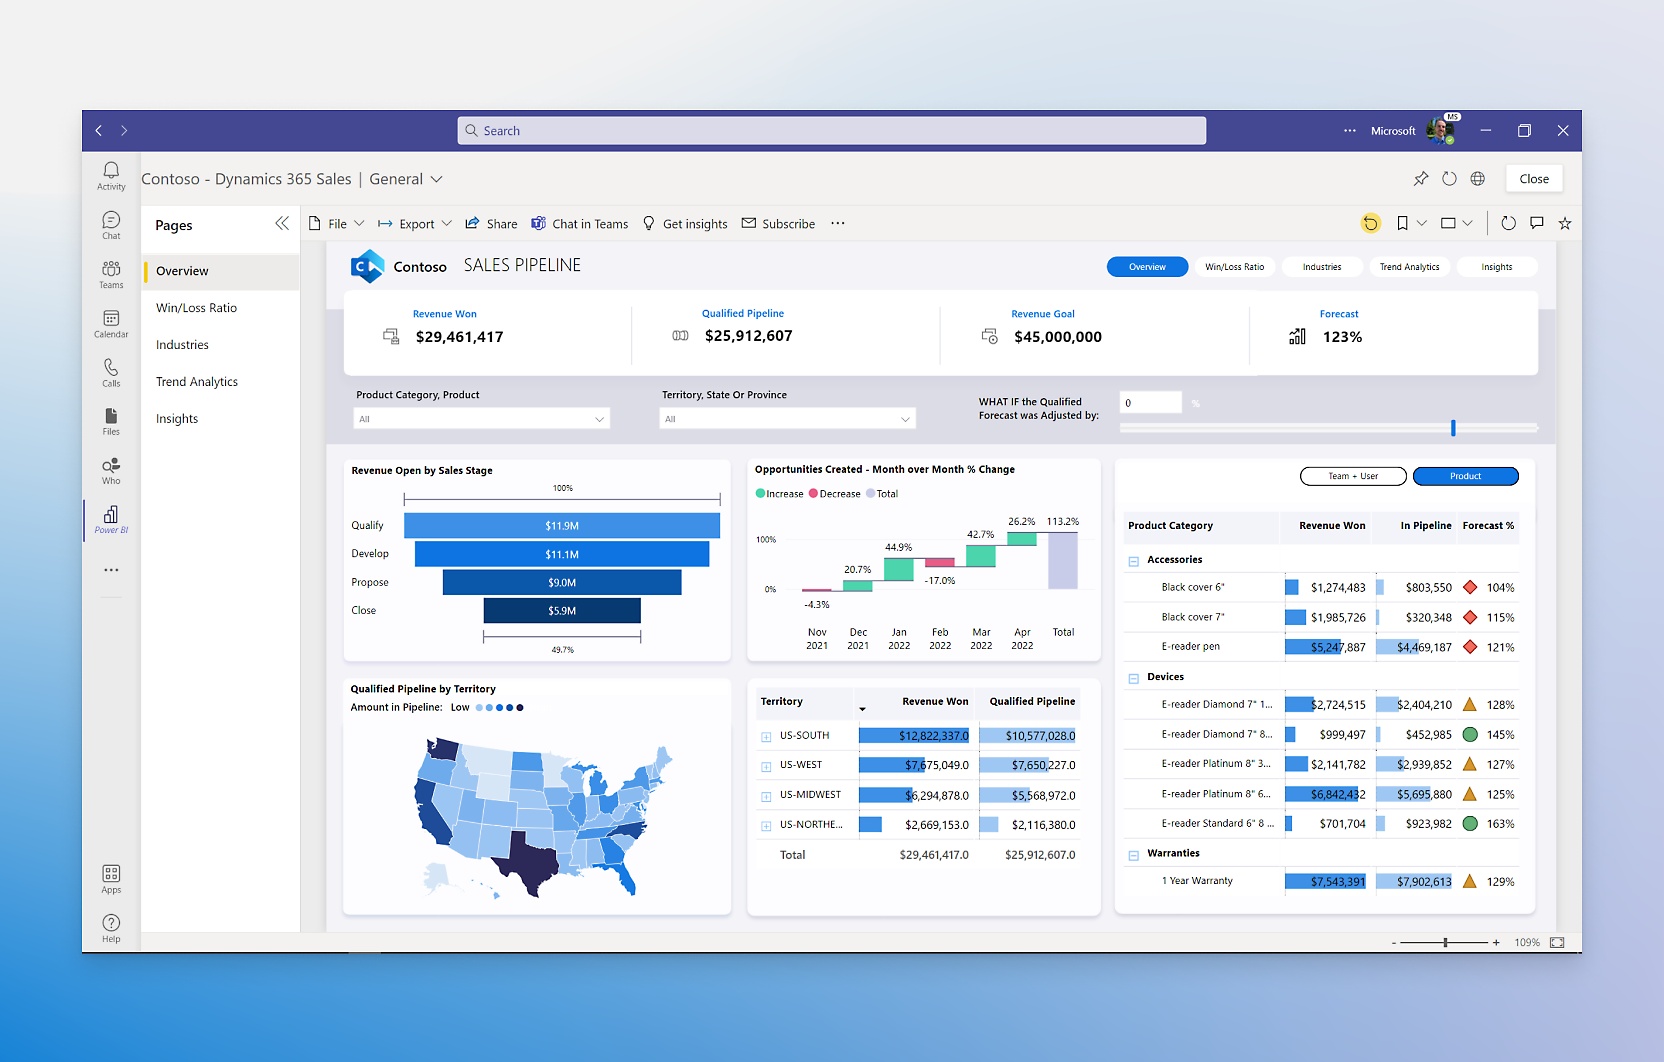
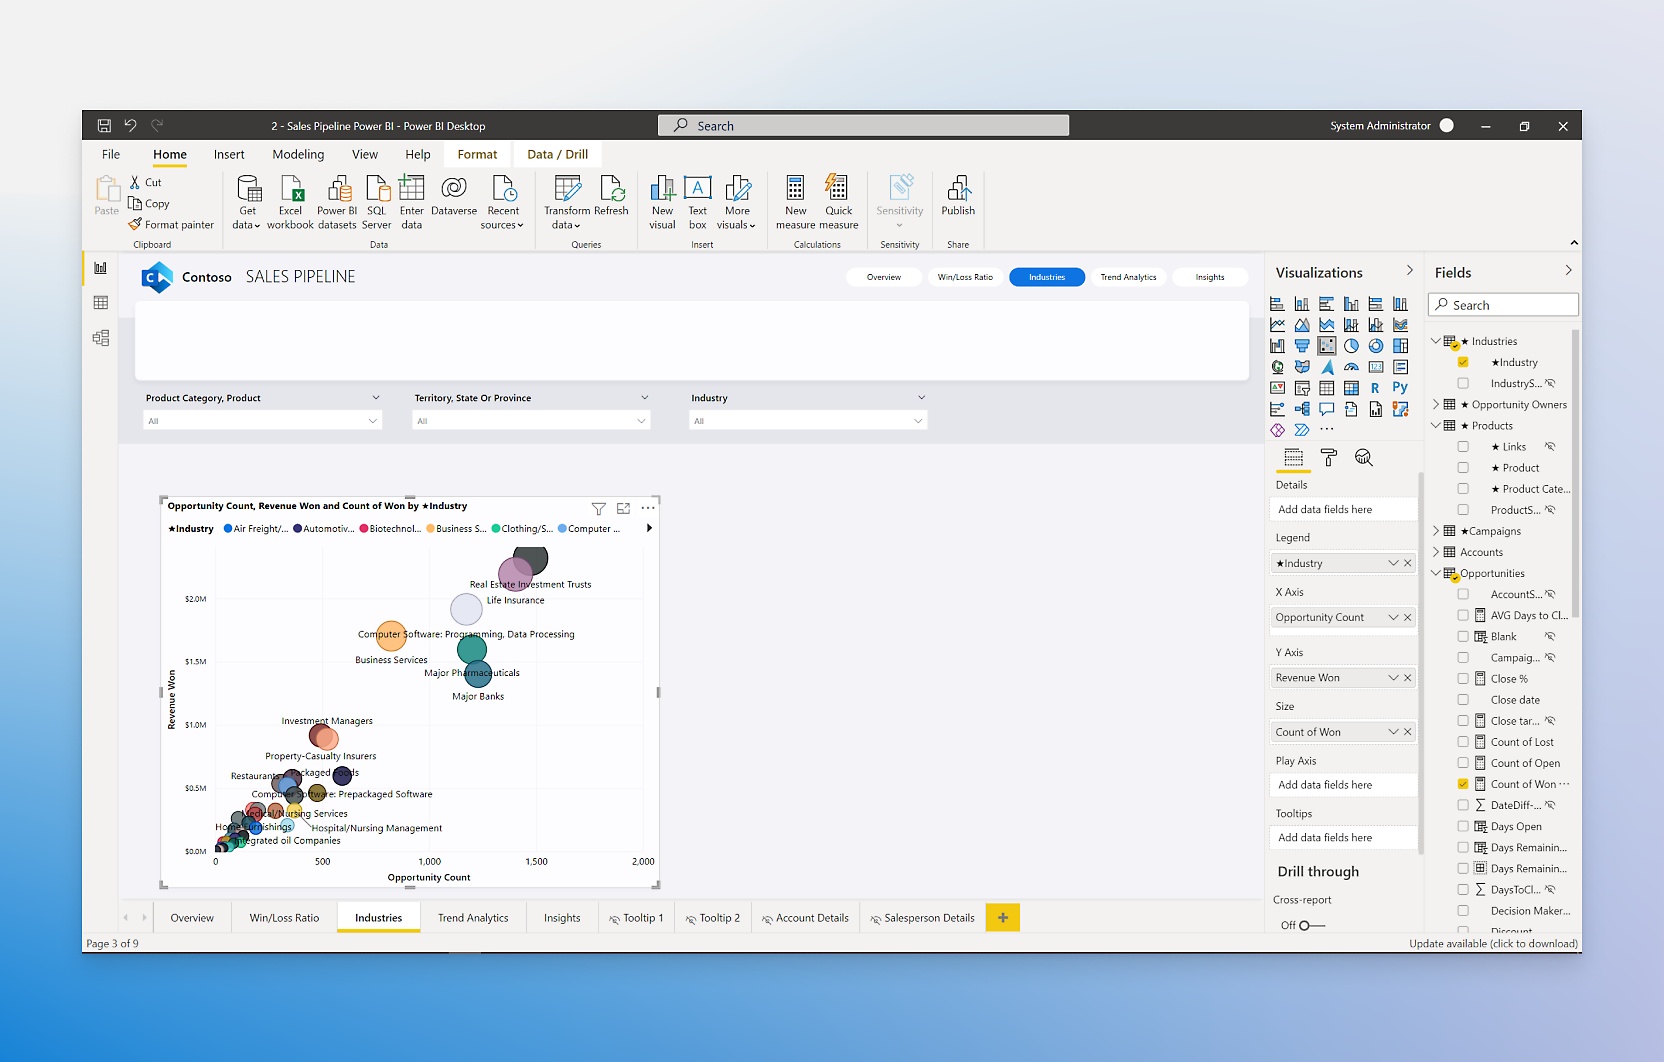
- Transform petabytes with enterprise-grade ingestion and semantic modeling in a tool that can scale across thousands of users.Easily embed and share reports in your other Microsoft services, including Teams, PowerPoint, Excel, and Power Platform.Employ easy-to-use AI features that can find patterns in data, create reports instantly, provide answers, and more.Meet your requirements and gain end-to-end visibility with Microsoft governance, security, and compliance.
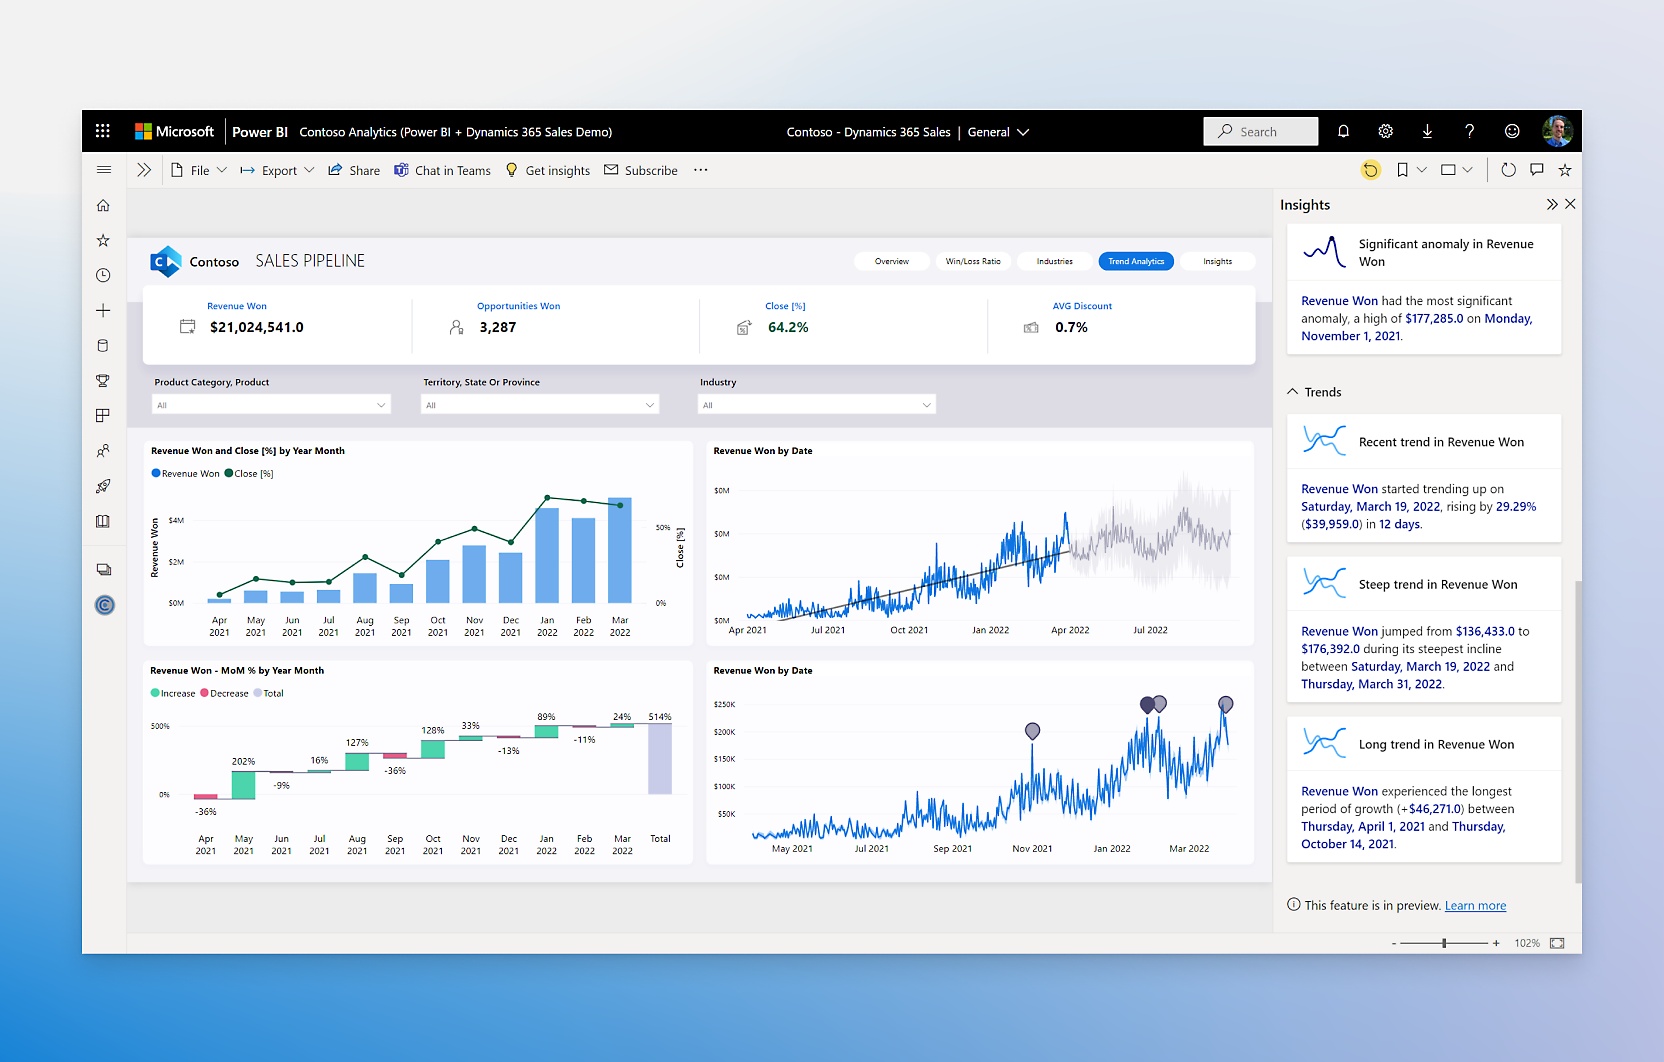
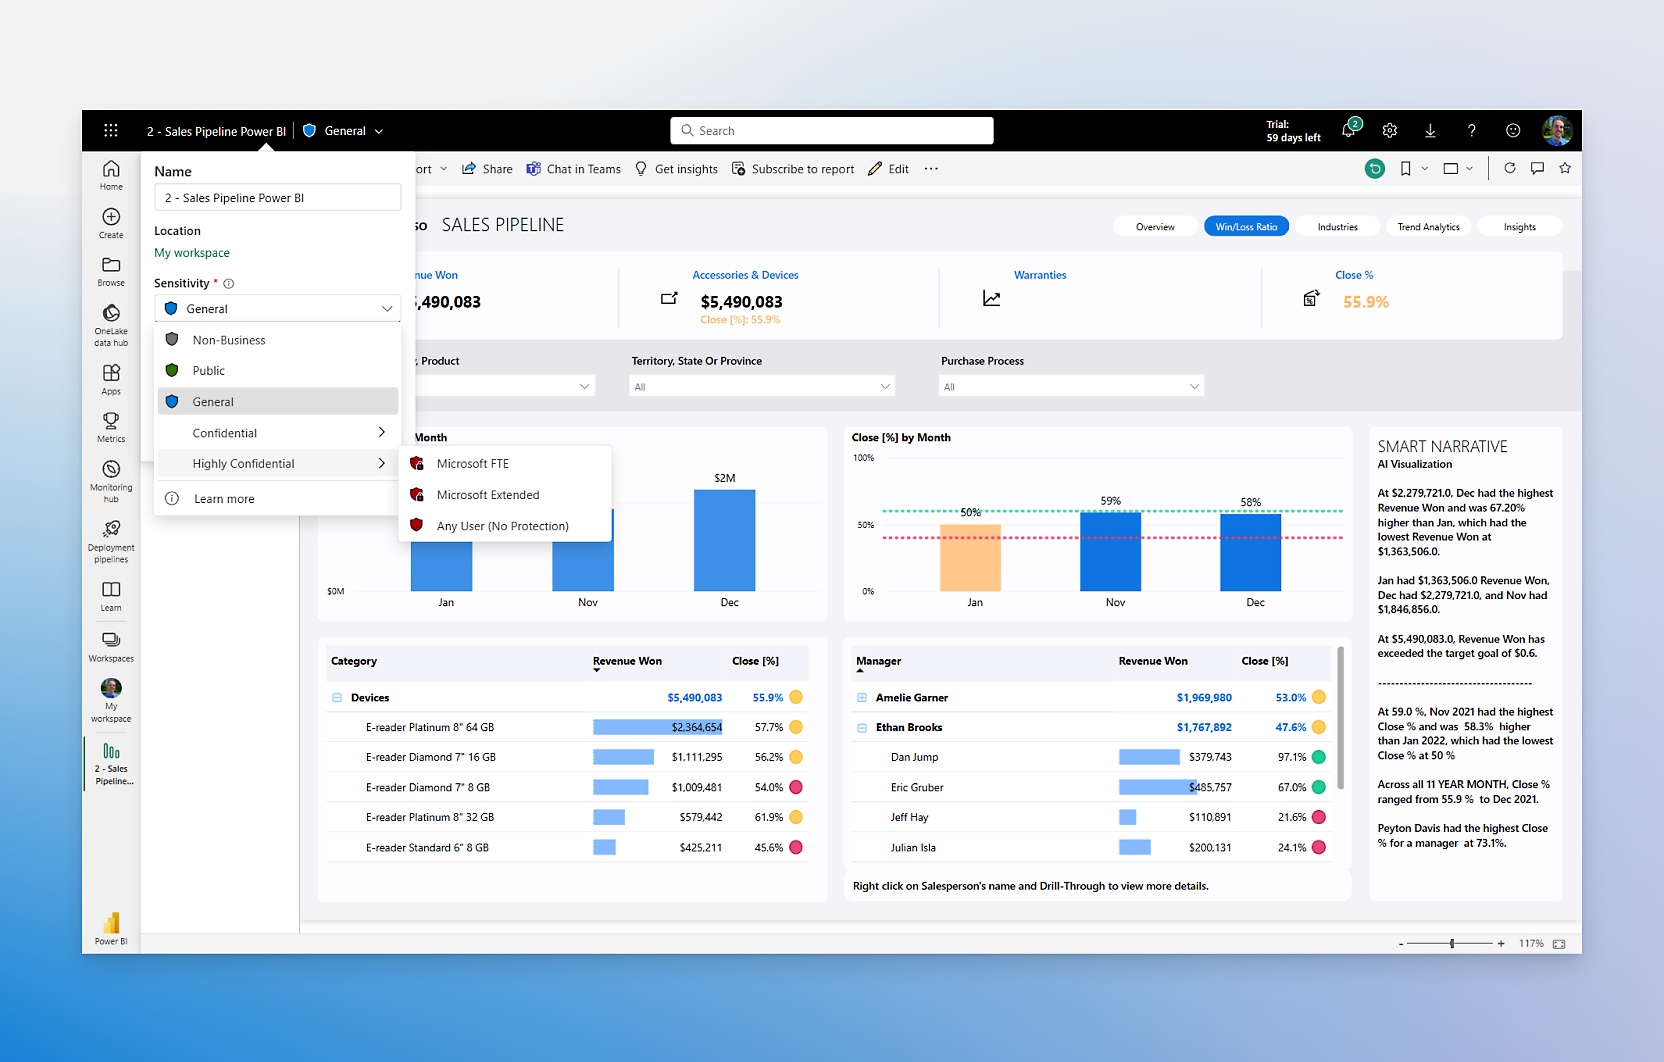
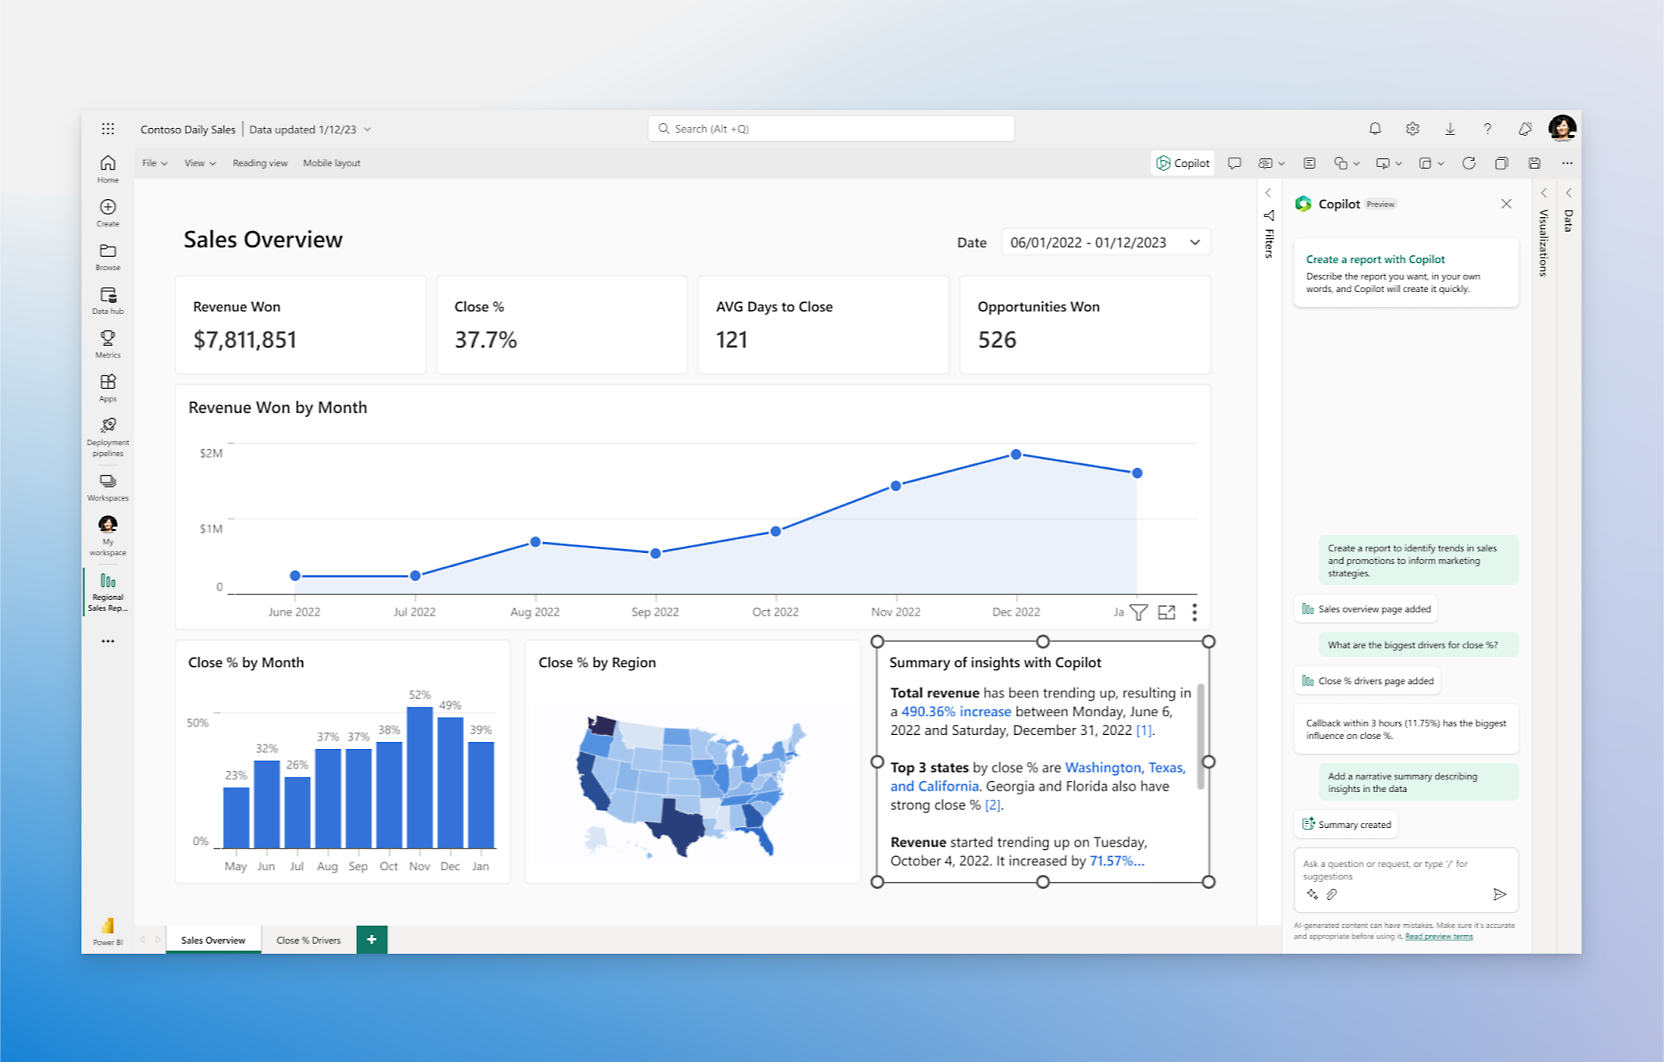
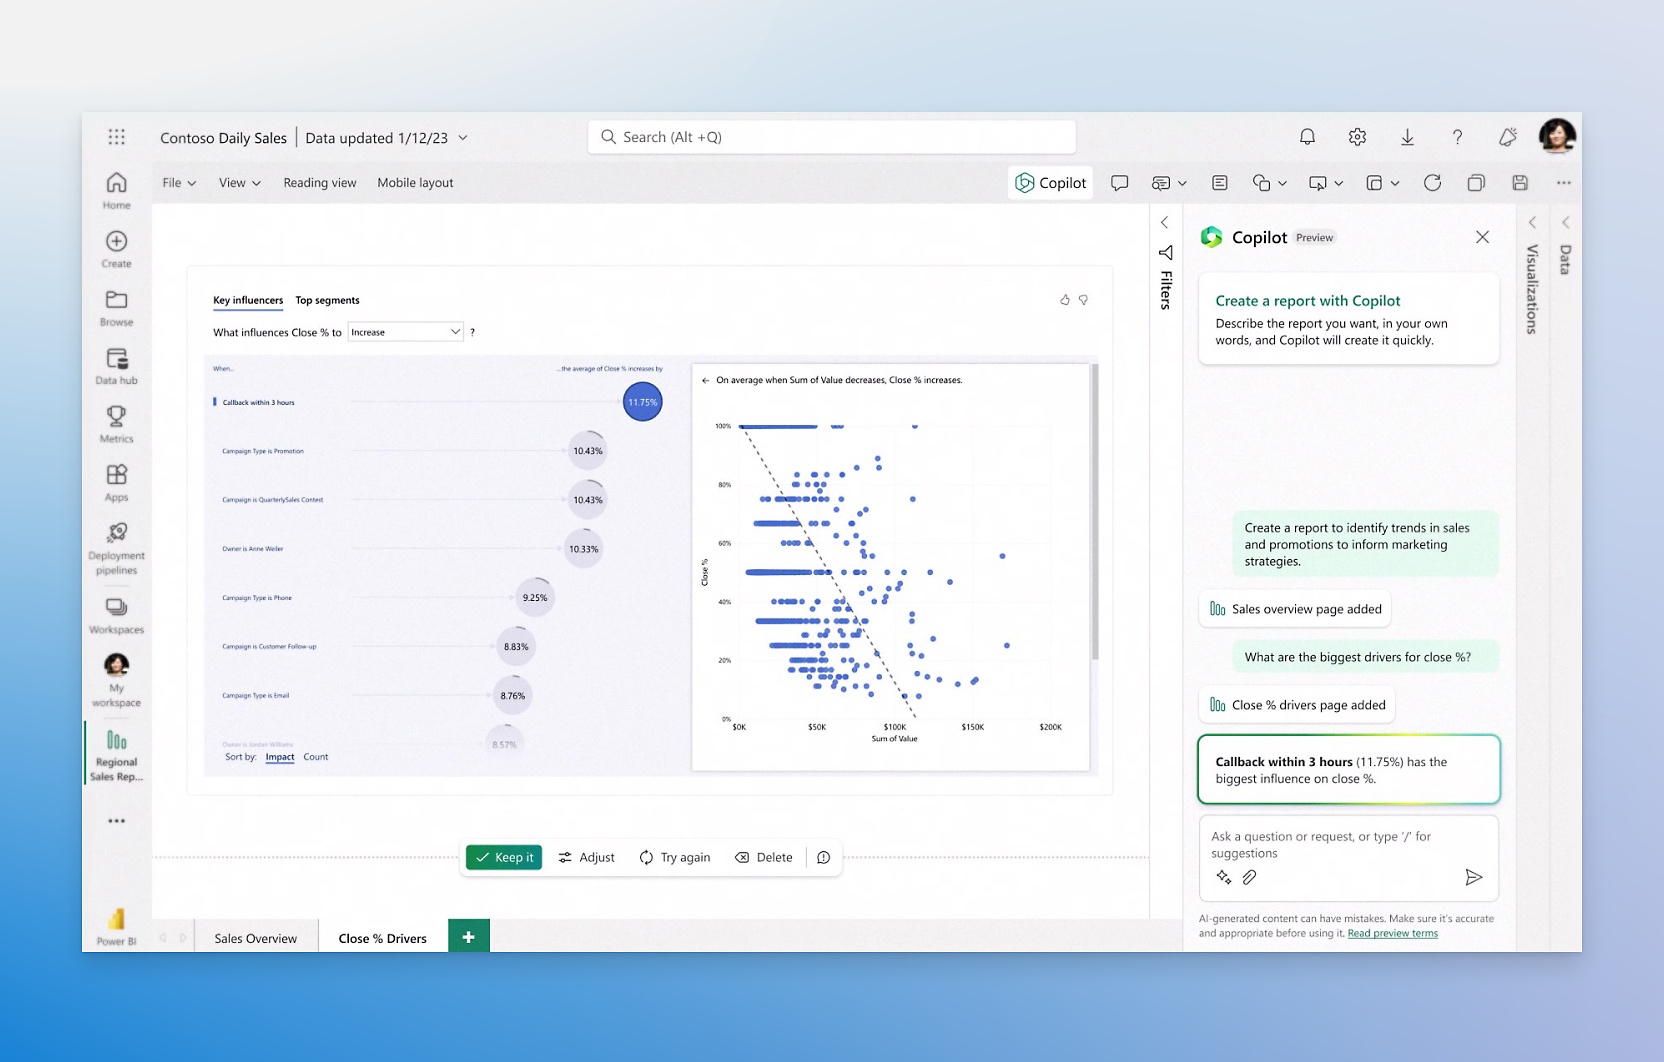
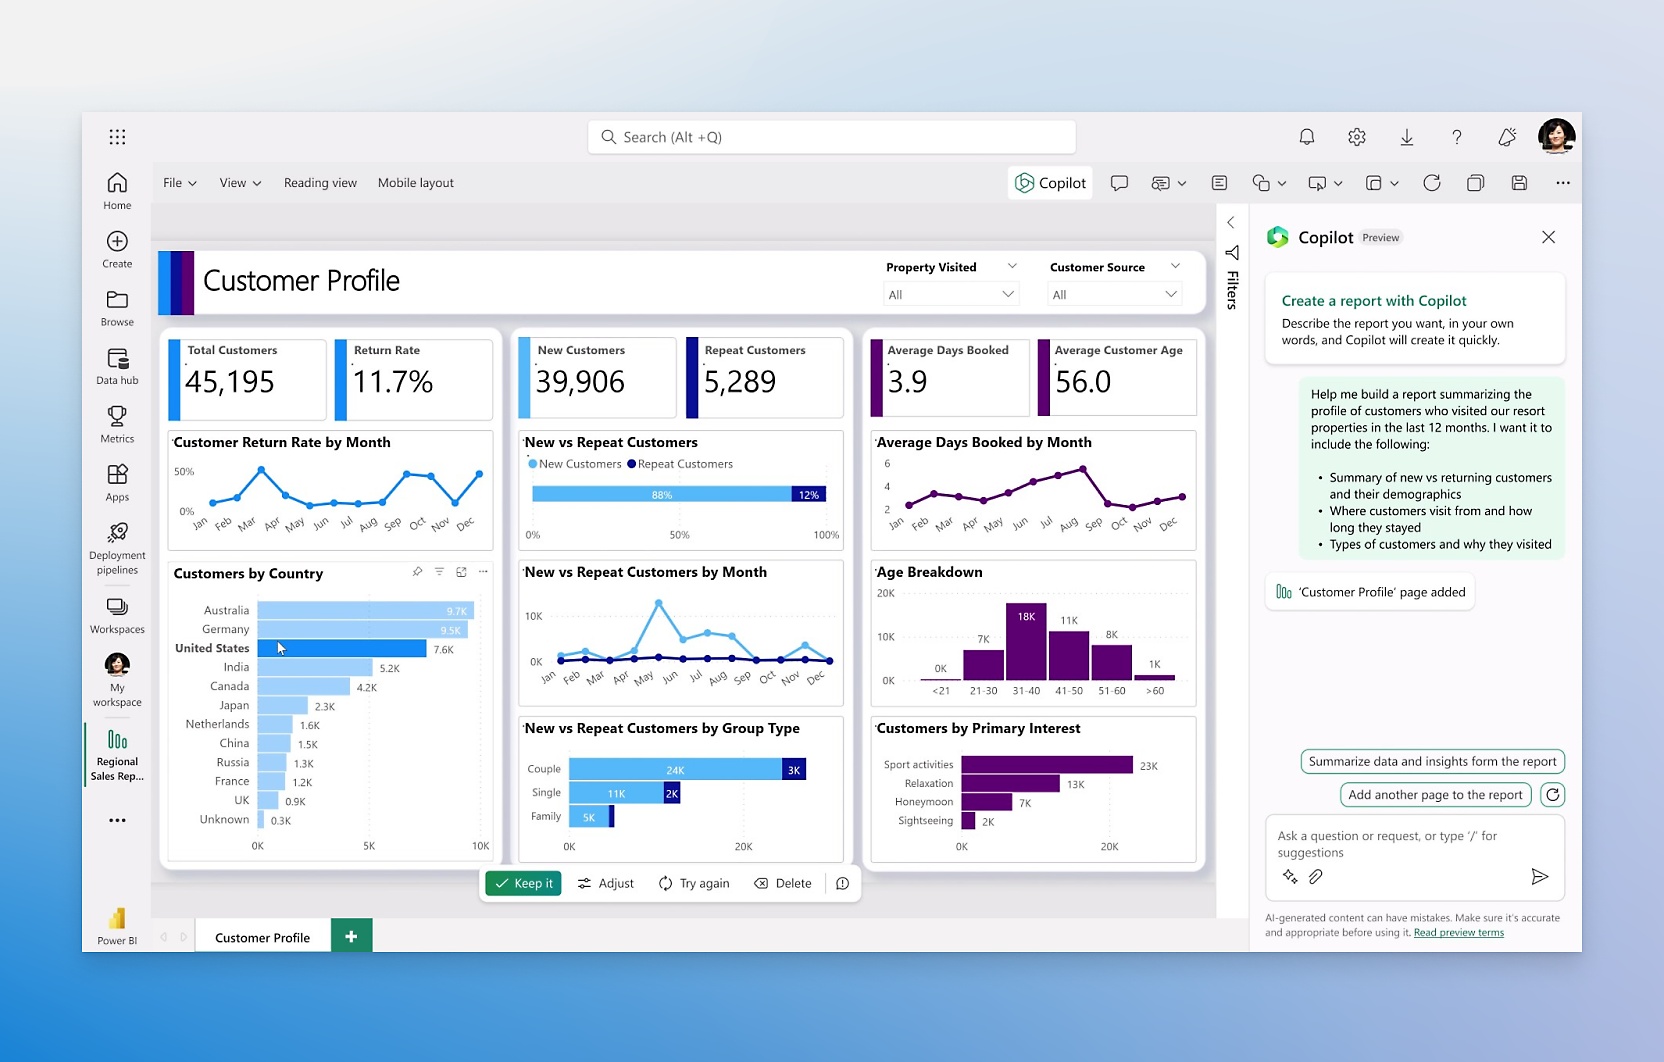
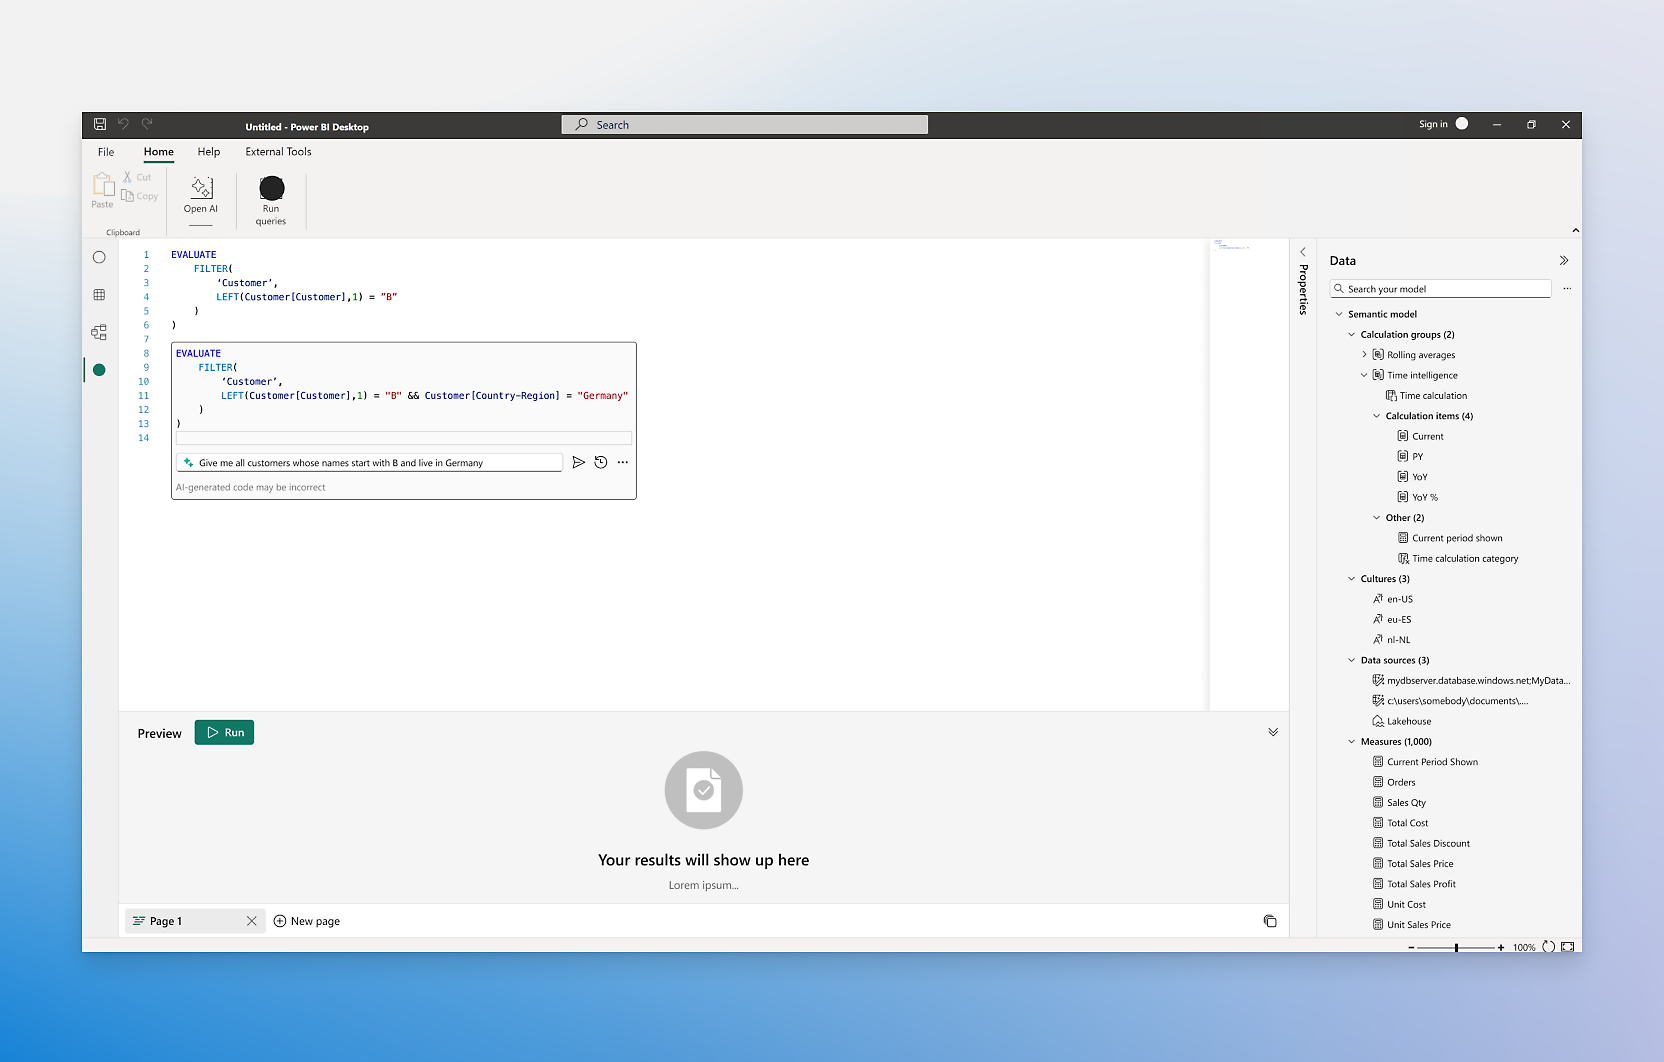
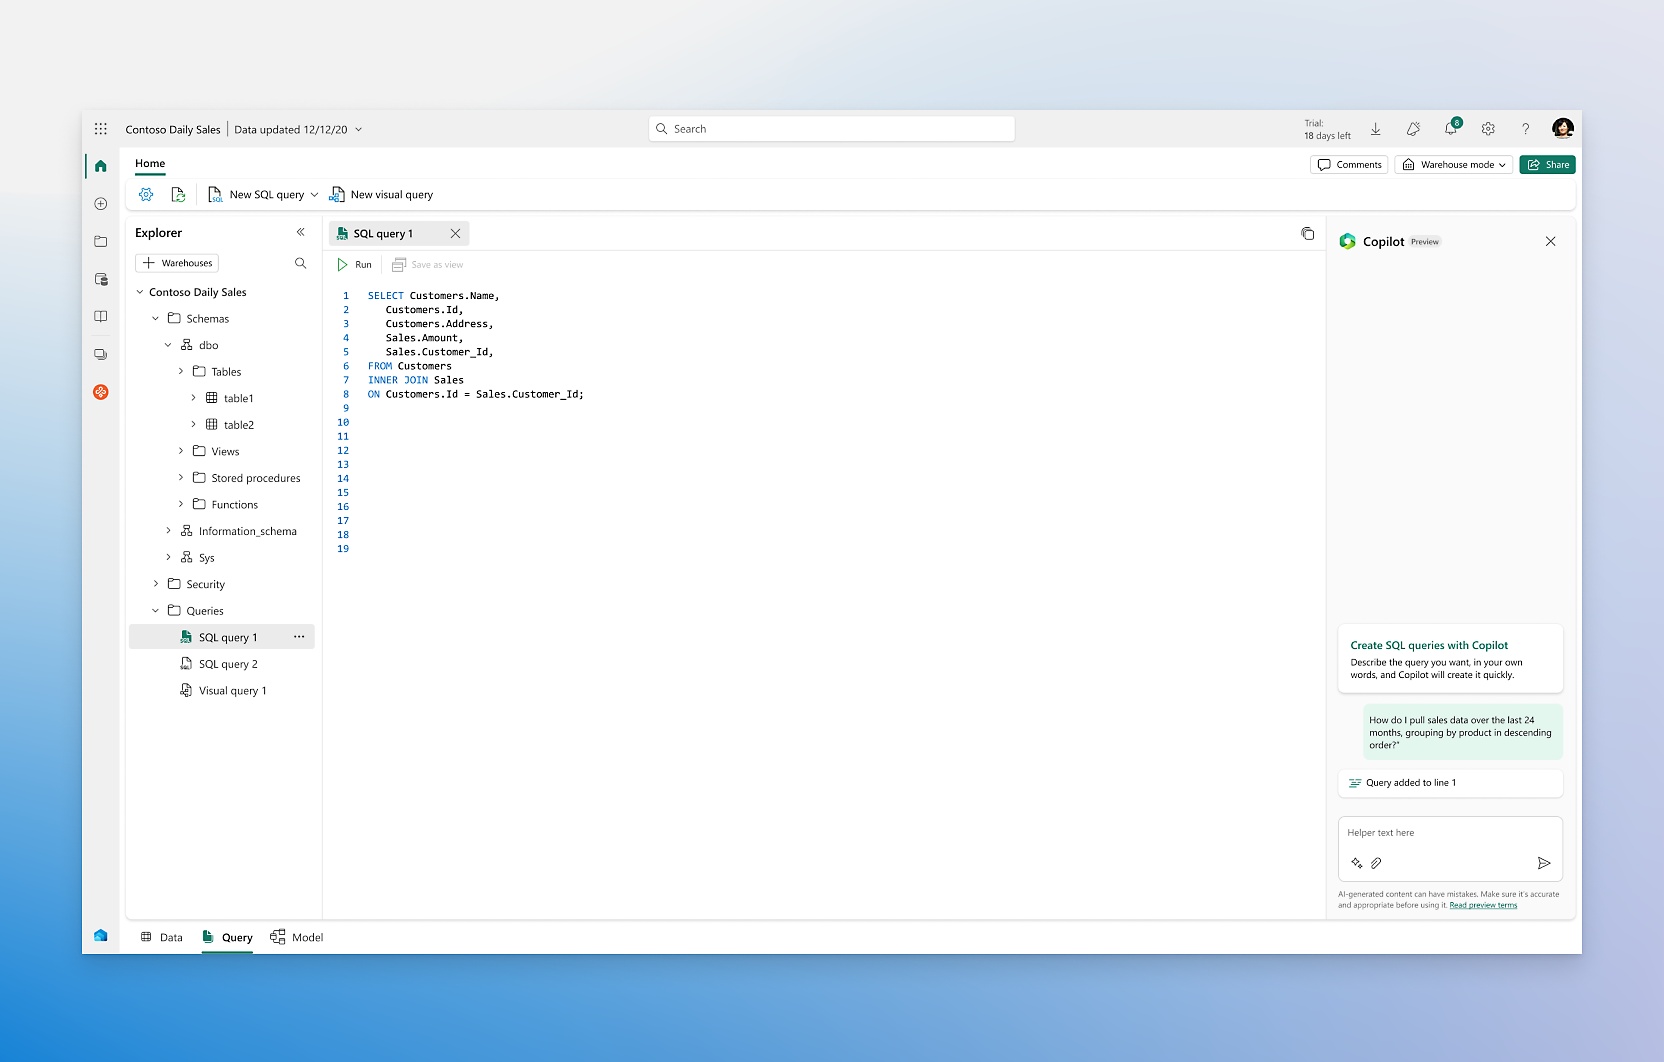
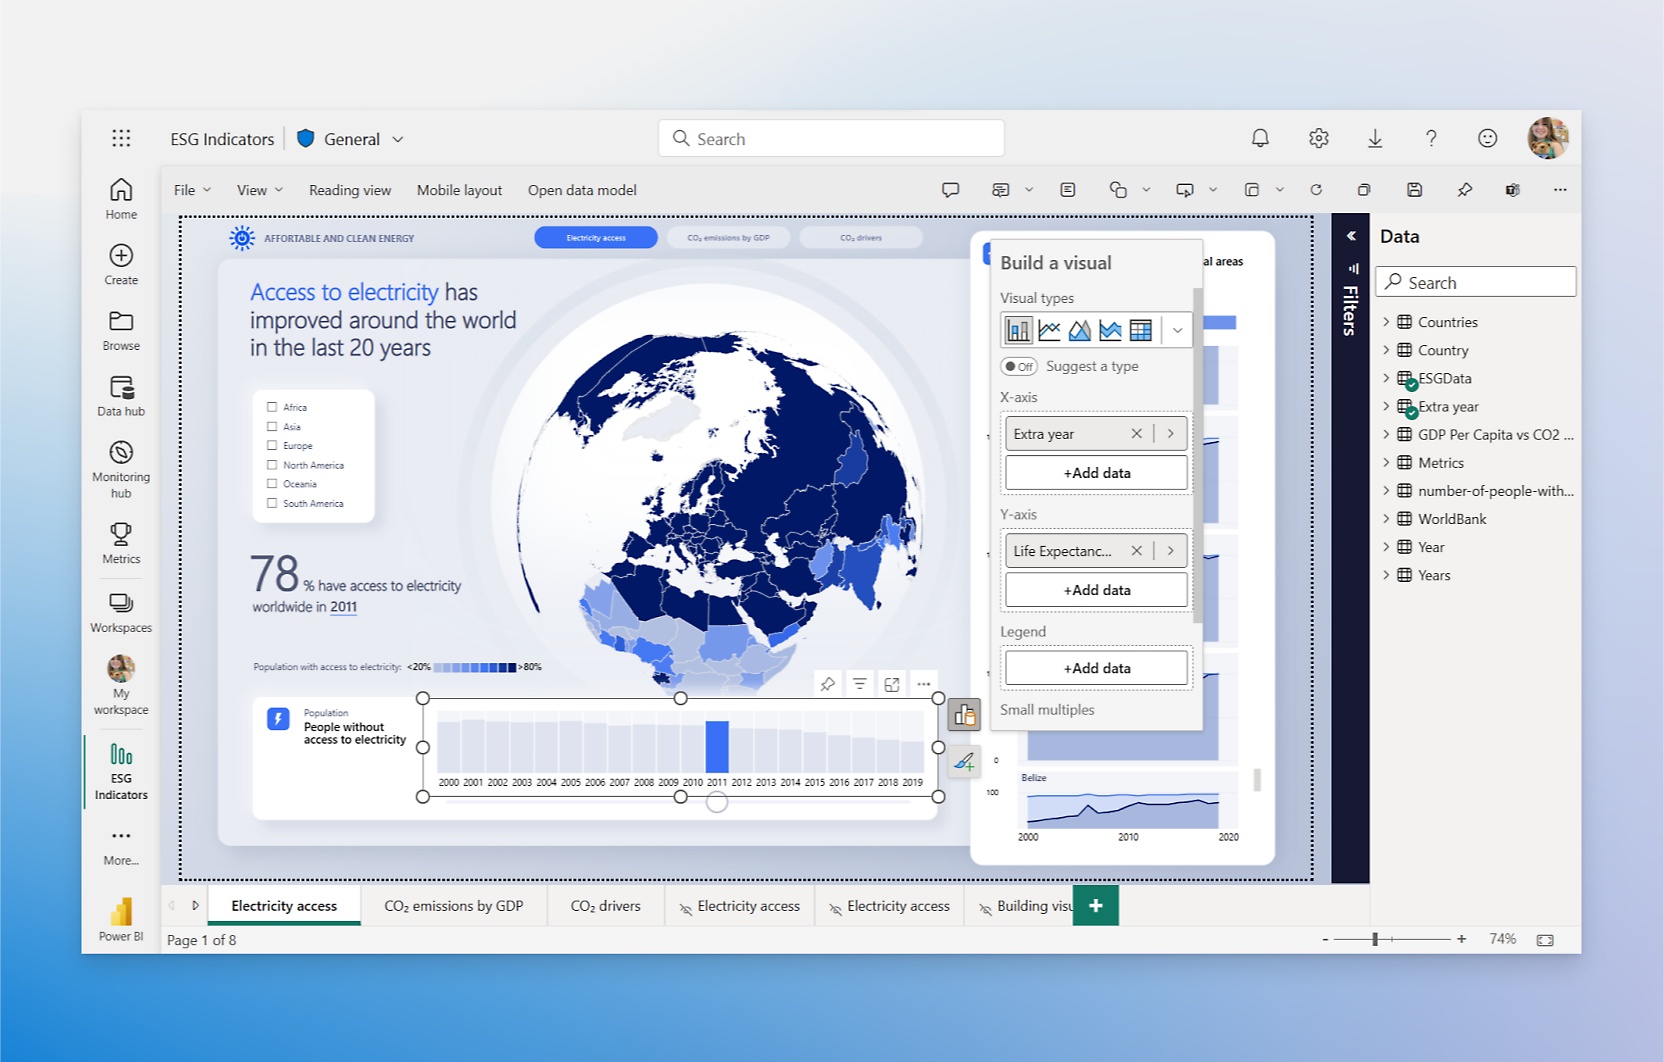
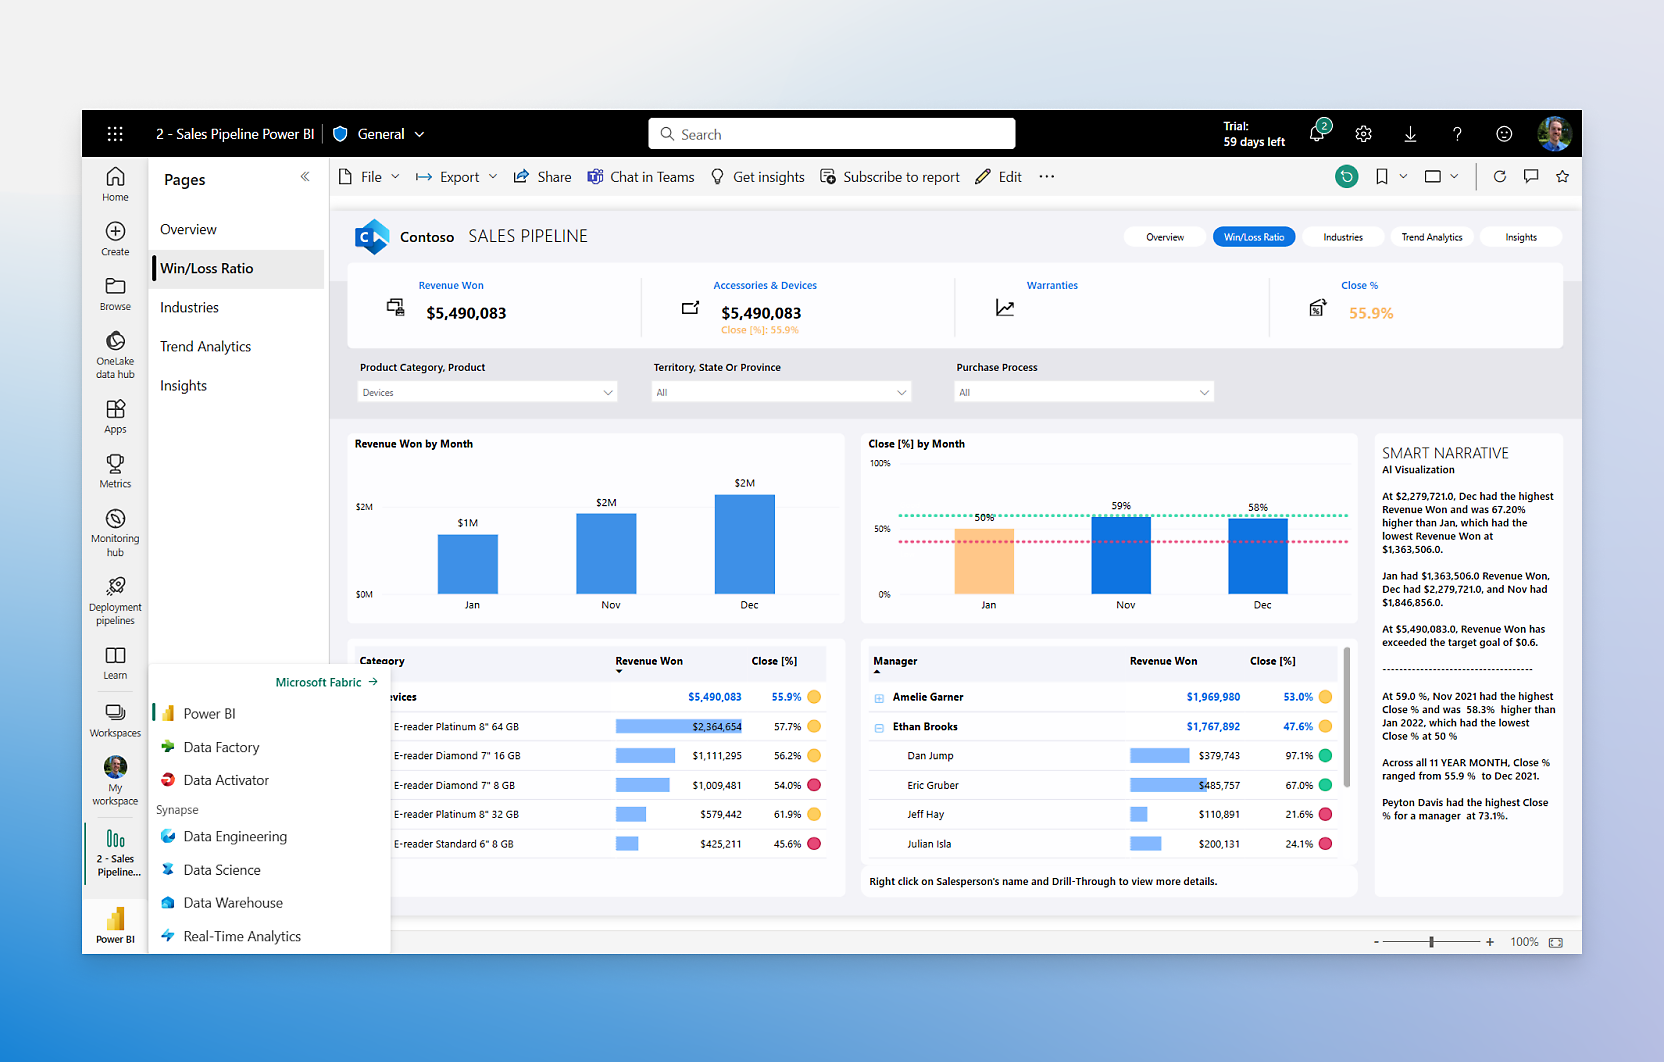
- Create reports in seconds, generate DAX calculations, create summaries, and get answers, all in conversational language.Quickly create and tailor reports by simply describing what you want or asking questions about your data.Quickly understand your data by adding insightful text summaries, and even tailor the tone, scope, and style of narratives.Create DAX calculations faster by asking Copilot in Power BI to suggest relevant code and entire functions.
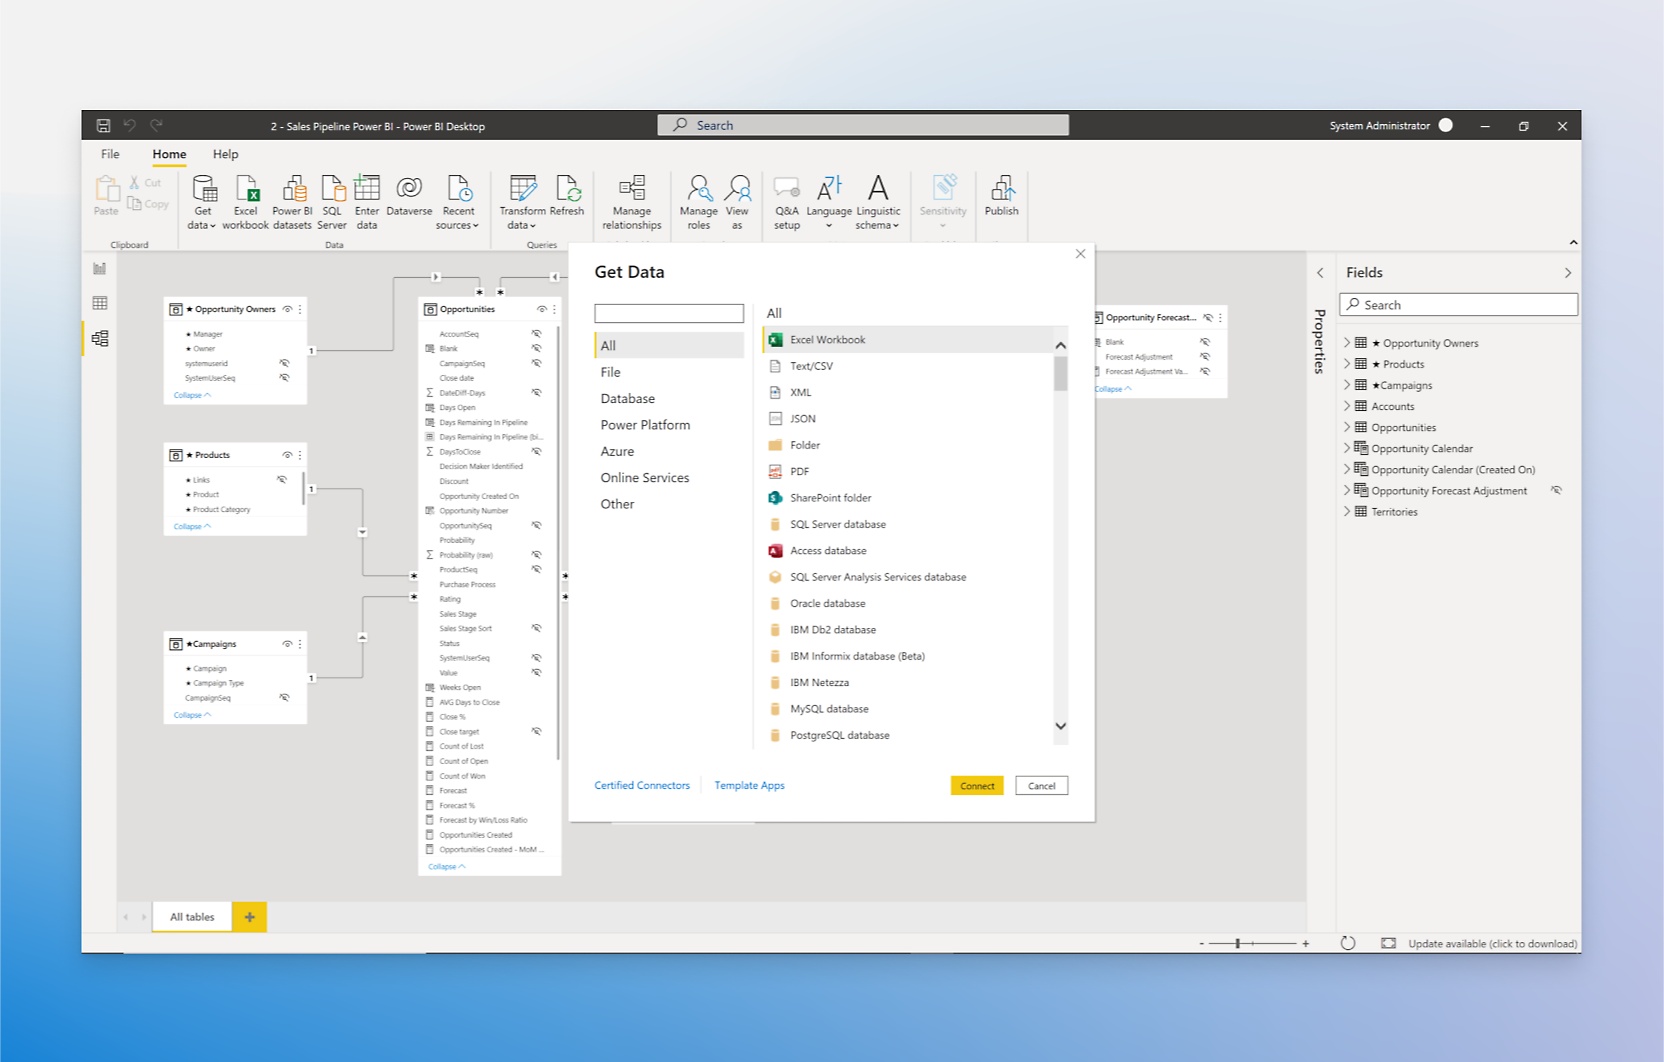
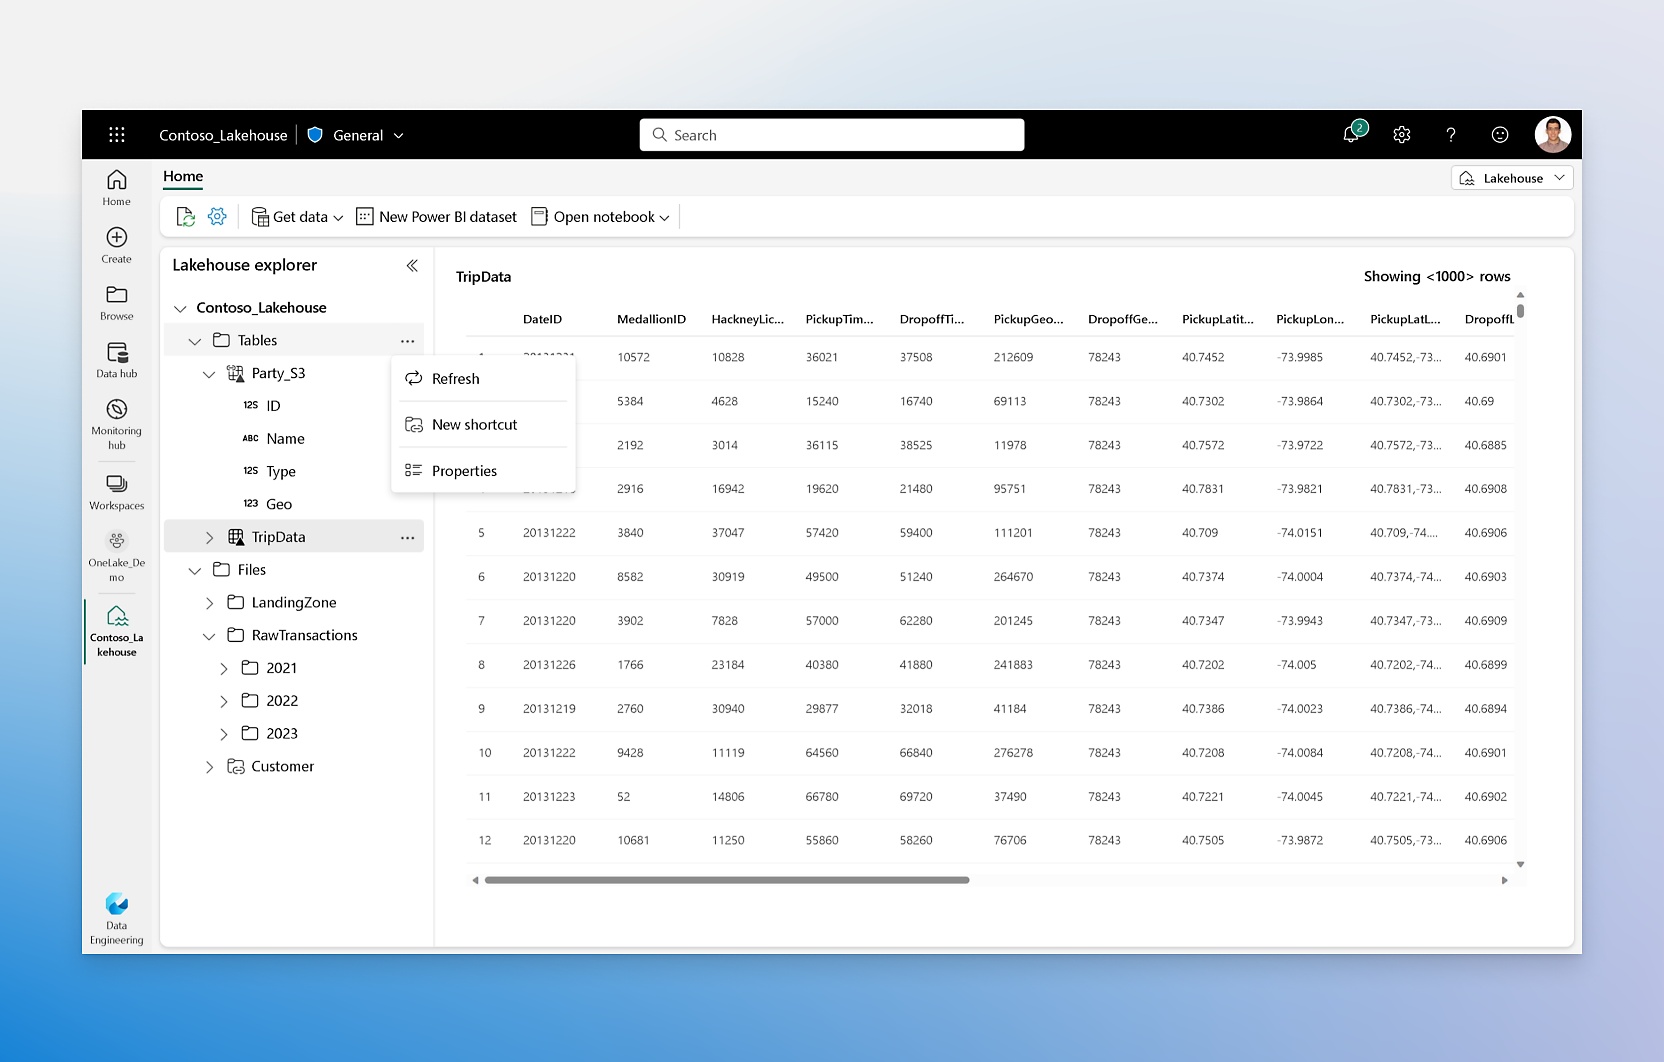
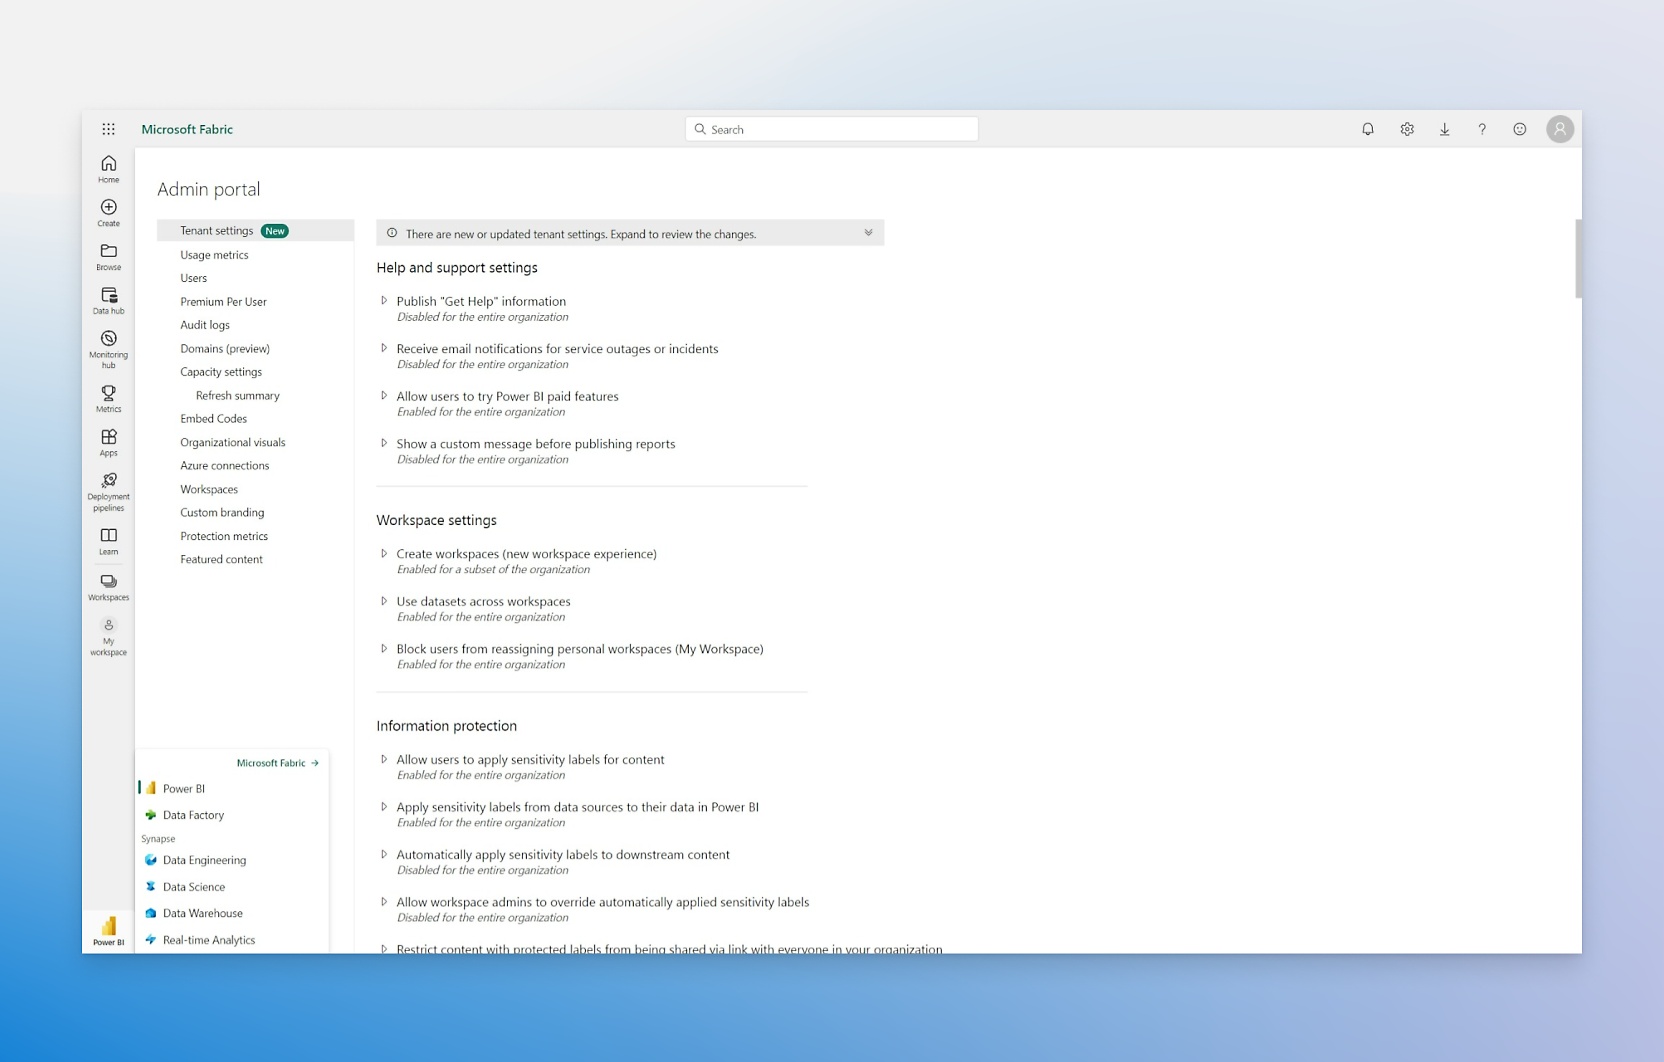
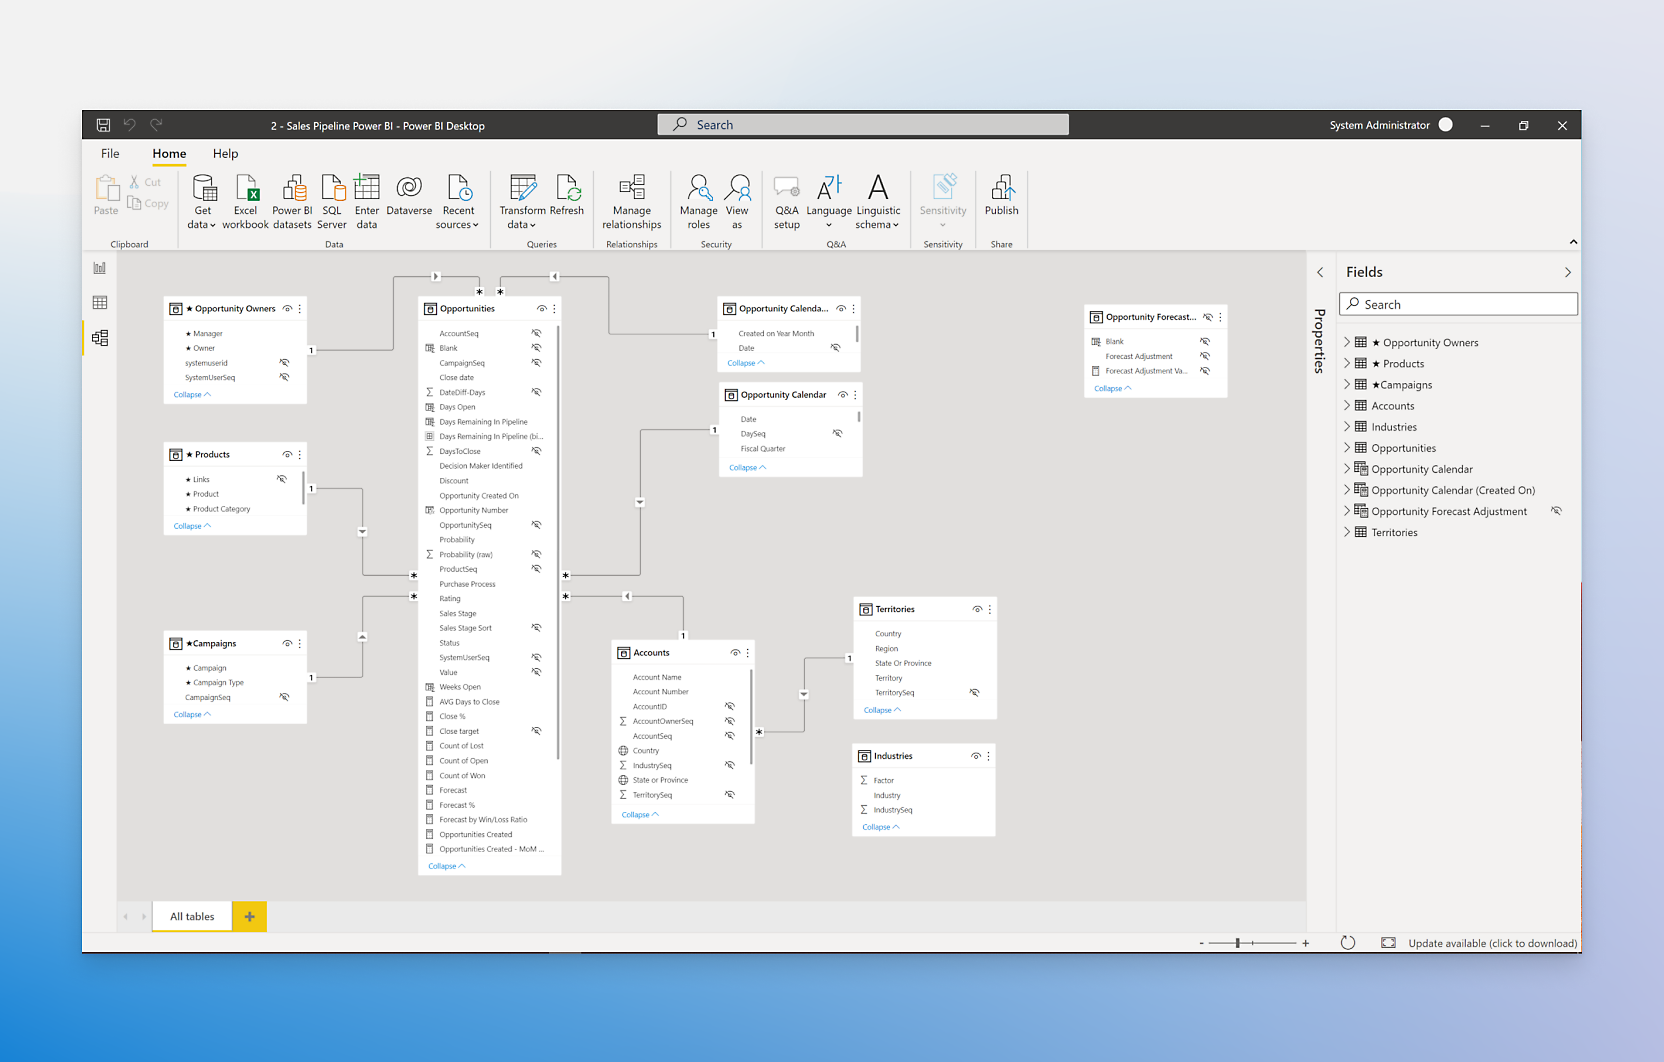
- Enable users without paid licenses to interact with reports and access the rest of your Microsoft Fabric workloads.Establish an open data hub with OneLake to help data engineers connect and curate data from different sources.Employ the suite of Microsoft Fabric workloads to integrate, process, analyze, monitor, and visualize your data.Responsibly connect people and data using an open and scalable solution that gives data stewards additional control.
- License individual users with modern, self-service analytics for publishing reports and viewing content.Enable users to create reports and publish them to share with their coworkers, helping to foster self-service BI.Get Power BI Pro with other Microsoft 365 apps and industry-leading Microsoft security for one low price per user.
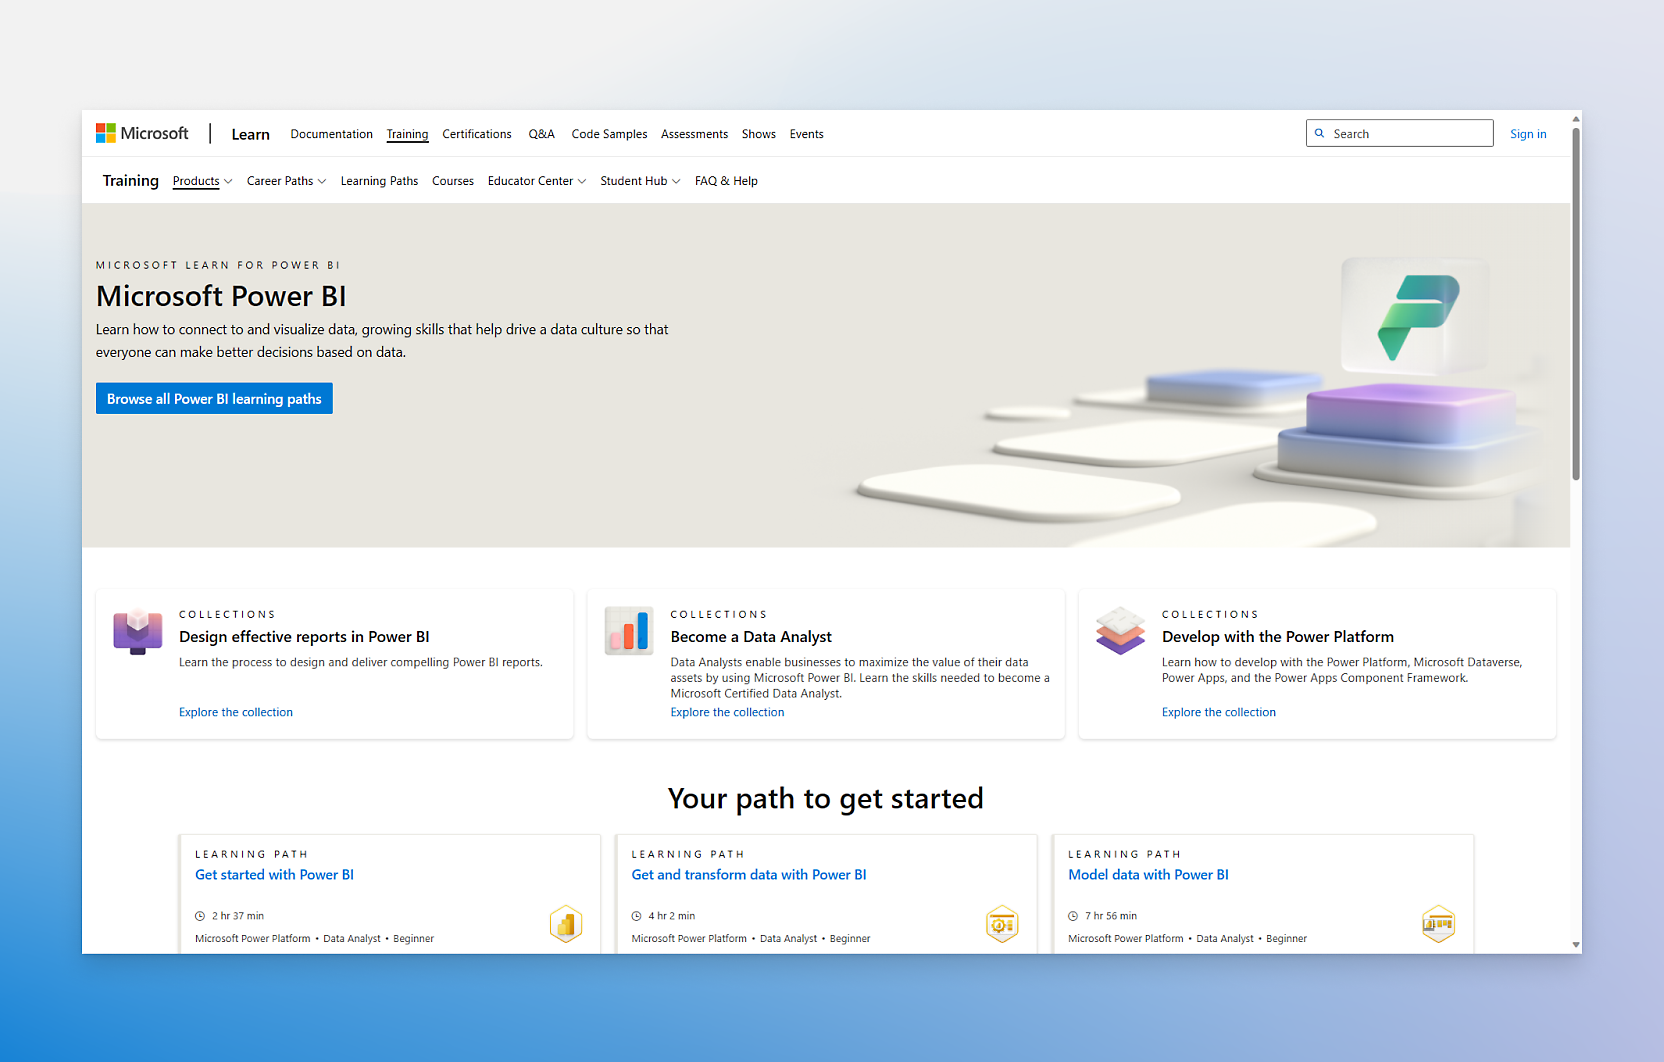
- Author reports for your own use or view Power BI content hosted in a Power BI Premium or Microsoft Fabric shared capacity.Use the free app to connect, model, and visualize data with an easy-to-use report canvas and hundreds of visuals.Sign up for the Microsoft Fabric free trial to explore the full suite of services—including everything Power BI has to offer.Get step-by-step guidance and explore key Power BI capabilities by taking Microsoft training courses.

See what you can do with Power BI
Establish a governed source of truth
Unify enterprise scale and self service
Infuse data experiences everywhere
Empower anyone to work with data
Get started immediately
Embed BI reports for your customers


Power BI + Microsoft 365: Greater productivity
Analyst research and news


Plans to suit every need
Free account
Power BI Pro
Power BI Premium Per User
Power BI in Microsoft Fabric

Powerful alone, better together


Gain visibility into your data estate
Real customers, real results


Explore everything Power BI has to offer


Frequently asked questions
-
Power BI is a unified, scalable platform for self-service and enterprise business intelligence (BI). Connect to and visualize any data, and seamlessly infuse the visuals into the apps you use every day.
-
Power BI licenses aren’t exclusive—there are several ways to mix and match plans and licenses. For example, you could purchase Premium (P-SKU) or Microsoft Fabric (F-SKU) capacity to host the most popular reports, and then buy Power BI Pro licenses (or get them through Microsoft 365 E5) for your users who need to create and publish reports. Contact a sales expert to learn more.
-
Microsoft Power BI Embedded is a pay-as-you-go Azure platform as a service (PaaS) offering. It allows app developers to embed fully interactive reports into their apps without having to build their own data visuals and controls. Power BI Embedded costs as little as $1 per hour for analytics, with no requirement for end-user licensing.
-
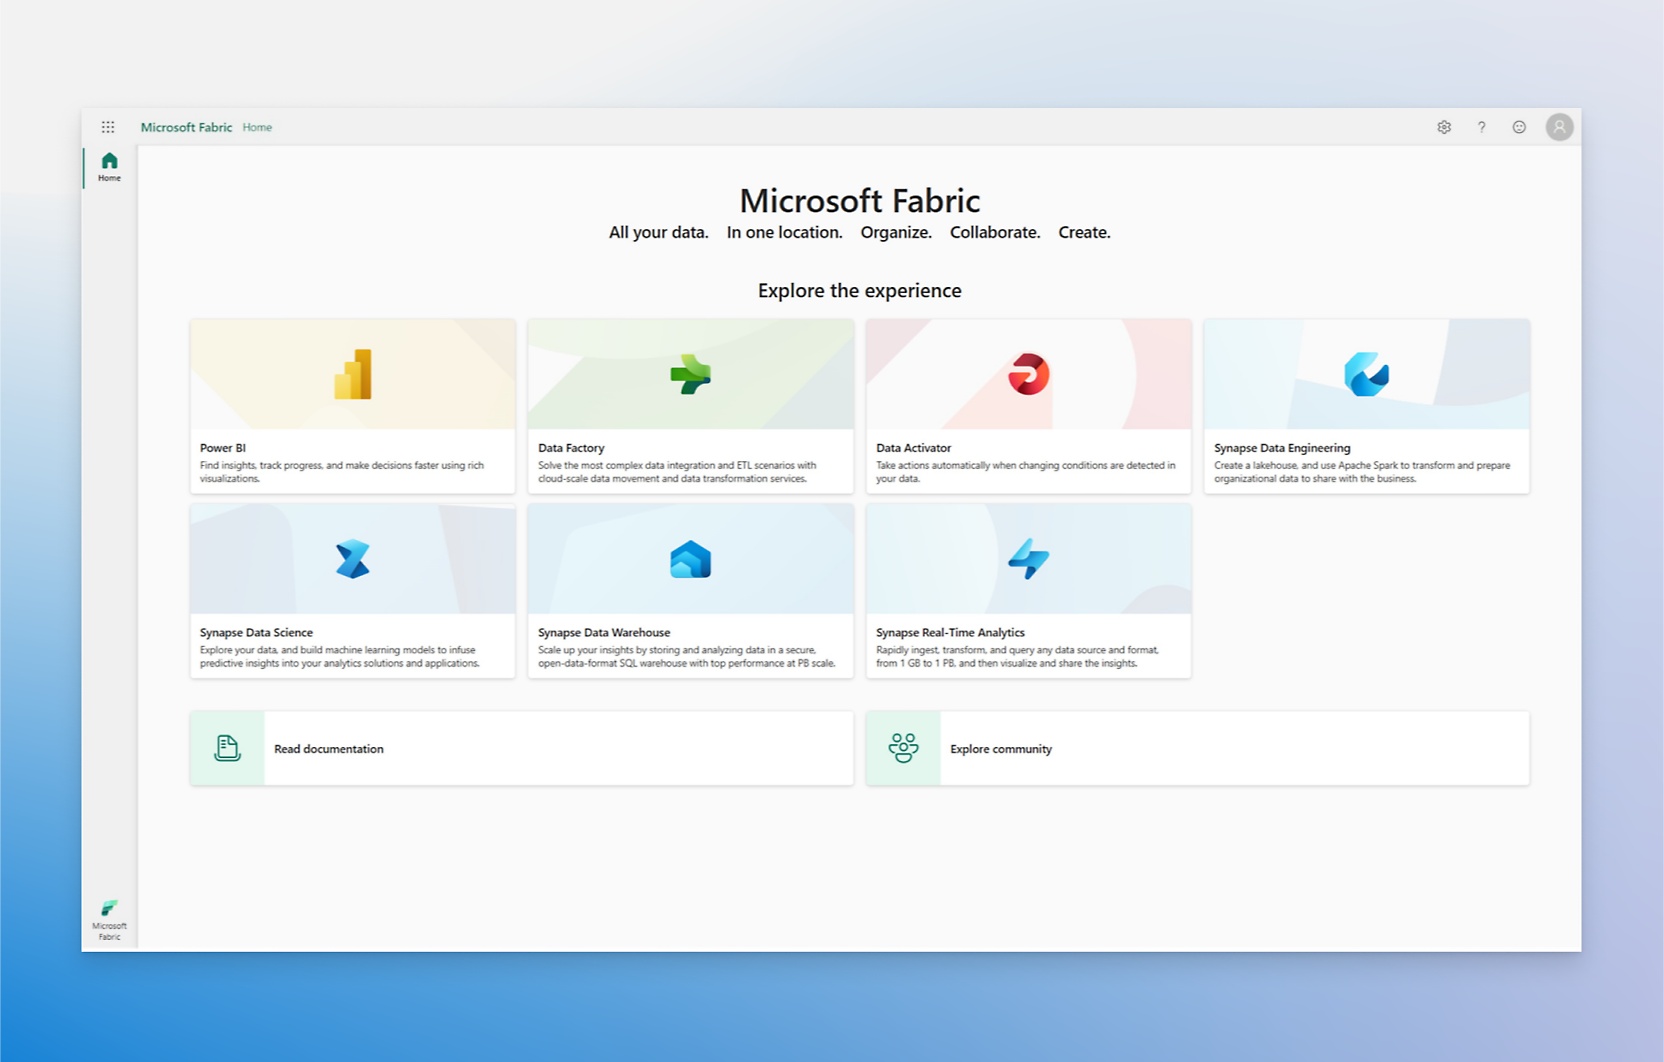
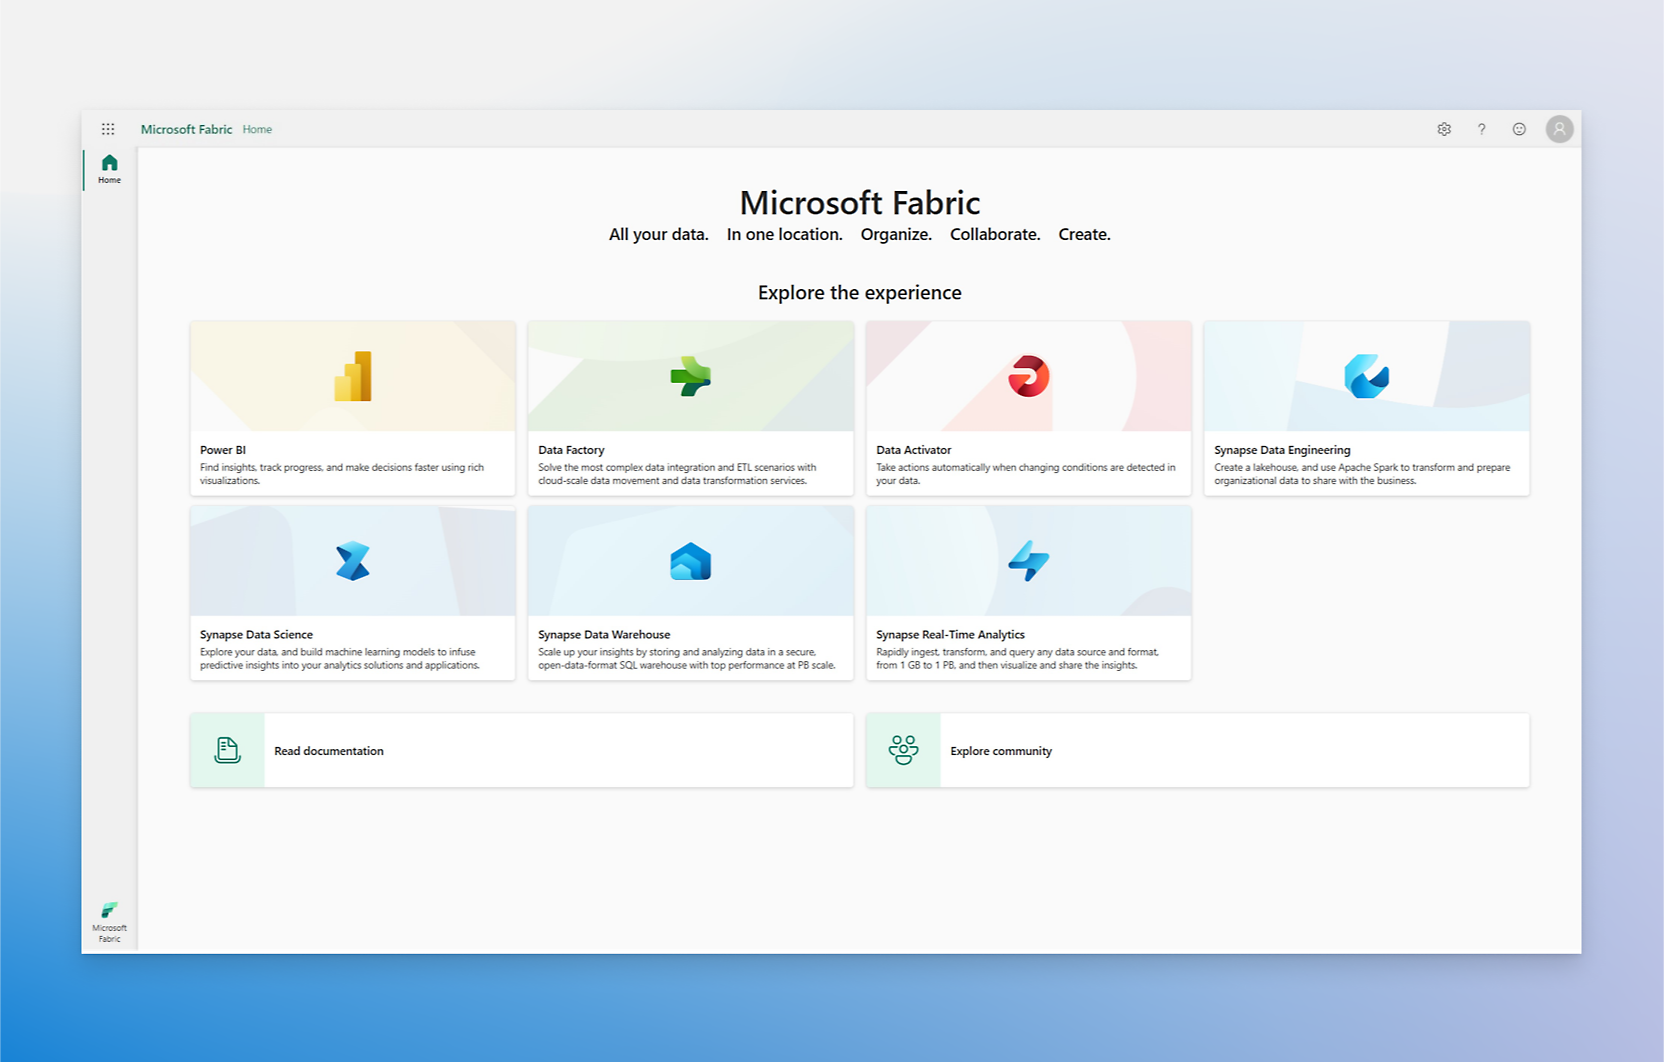
Microsoft Fabric is an end-to-end analytics solution with full-service capabilities including data movement, data lakes, data engineering, data integration, data science, real-time analytics, data monitoring, and business intelligence—all backed by a shared platform providing robust data security, governance, and compliance.
-
Power BI provides the industry-leading BI in Microsoft Fabric that enables you to gain insights from data. Power BI Premium per capacity customers can simply turn on the Fabric tenant setting and access the rest of the product in a unified experience. And with its unified capacity model, Power BI Premium per capacity can be used against any Microsoft Fabric workload.
-
Power BI Pro customers can access Fabric workloads only through the Microsoft Fabric trial experience.

Follow Power BI