This content has been archived, and while it was correct at time of publication, it may no longer be accurate or reflect the current situation at Microsoft.
 Microsoft Digital Employee Experience (MDEE), the organization that is powering, protecting and transforming Microsoft supports a wide variety of apps and services across the organization that are used to engage with customers, track leads, fulfill goals and objectives, and deliver products and services. The apps we support come from several different sources: Microsoft product-group development teams, third-party vendors, and our development teams within MDEE. While Microsoft Azure has native tools to monitor most application components, our app portfolio’s distributed nature makes it difficult to trace a customer’s experience along business processes, regardless of the underlying infrastructure. As the reach and responsibility of our app portfolio in Azure increases, so does the need for a more complete, concise picture of our end-to-end business process.
Striving to serve the customer’s needs
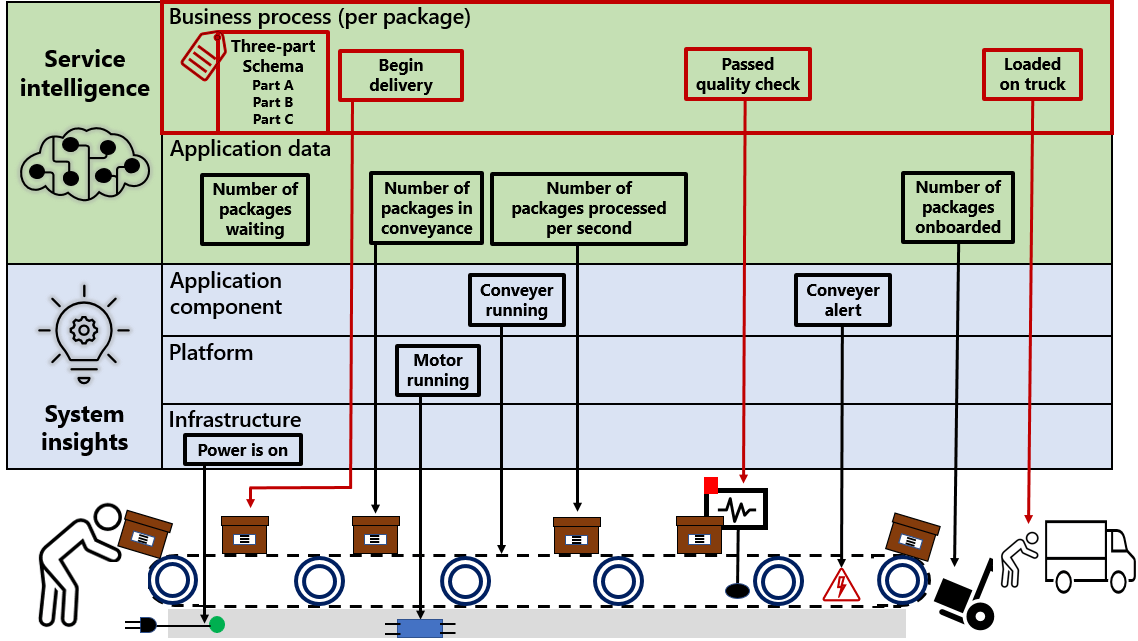
Like most large enterprises, MDEE supports a large and diverse app and service portfolio. Most apps and services have built-in logging and reporting for application, platform, and infrastructure components. However, many of our business processes require application data and business process-specific telemetry to complete the end-to-end user perspective. To effectively track business process dataflow in this environment, we need a standardized method for collecting data. After monitoring solutions collect data in a central location, we aggregate, combine, and manipulate that data to gain insights into user behavior and the end-to-end business process. The figure below presents an example of how application and business process telemetry are collected alongside application, platform, and infrastructure data to capture a complete business process workflow.
We use telemetry-based data solutions to address several issues and needs that Microsoft employees and business groups report:
- It can be difficult to understand information that is available without duplicating data or work. Employees use a wide variety of apps, which can lead to overlapping functionality, depending on the customer and product they work with. In some cases, it’s difficult for an employee to get 100 percent of the information about a business process without moving in and out of different apps and reporting systems.
- Our app portfolio is diverse in design. These apps gather information by using different standards and taxonomies, making it difficult to compare and combine data from them in a meaningful way.
- We want to extend monitoring and data-collection methods to include Azure-specific information and design methods that are pervasive in our app portfolio.
- We need to track our app portfolio in a holistic manner rather than on an app-by-app basis. We want to examine and understand any business process’s health as it moves from app to app. For example, when a salesperson reviews an open deal opportunity in Microsoft Dynamics 365 for CRM, they must be connected to the details in the Customer Planning app to determine how the opportunity might affect the overall team’s goals or to take actions connected to the opportunity.
Creating a framework for custom telemetry
Telemetry is the first step in the journey to know our customer better. We understand that one of the most important factors in bringing telemetry data together from multiple sources is developing a common taxonomy to identify and label data across multiple systems. Our telemetry taxonomy is composed of a three-part schema:
- Part A: System. These fields are defined by and automatically populated by the Logging Library on the local system where events are produced. There might be some fields that the Logging Library would need to get from the caller, but most of the time, the values populate automatically. Examples include Users, ClientDeviceIp, and EventDateTime.
- Part B: Domain Specific. The different Part B schemas and the fields that they contain are defined by centralized groups. The event fields are populated by code written by the Event Author. The Event Author has no control over the field naming or data types. Examples include PageView and IncomingServiceRequest. These are reviewed and published by the Microsoft data and analytics team.
- Part C: Custom Schema. These fields are defined by the Event Author, who has complete control over the fields’ naming and data type. We use a NuGet package that customizes this part of the schema. The package provides a telemetry base and the methods required to send data to the Azure App Insights telemetry client in the context of the custom schema.
The most important aspect of extending the telemetry environment across apps is establishing a common identifier for customers and transactions that existed in all apps. We developed a set of extensions that enabled us to create and maintain a common identifier we refer to as a correlation ID. The correlation ID allows us to pass information between apps for an employee or process so that data pulled from applications can be organized and displayed by that ID.
Extending apps for telemetry
To capture data effectively using the prescribed taxonomy, we created extensions to integrate into apps that were being developed. These extensions allowed us to set standards for telemetry data across multiple apps, which made it easier to query data and present it from the perspective of the customer experience. The extensions were created to be business-group agnostic. We’ve used them for sales apps, but they can be integrated into any app.
- App Insight Extensions. Provides a standard way of propagating the correlation ID across different services to trace business processes that span different service boundaries.
- Web Extensions. Provides templates to trace business process events and feature-usage events in a standardized way for web applications.
- JavaScript Extensions. Provides templates to trace business-process events and feature-usage events in a standardized way for JavaScript.
For apps that can’t be extended, logging and telemetry data (log files, database info, and other data sources) are ingested from the application source location. This process is managed and executed by using Azure Data Factory to automate the ingestion process on an app-by-app basis.
Building telemetry in Microsoft Azure
Most of our app and process infrastructure is hosted in Microsoft Azure, so we knew that we wanted a solution that was also Azure based. Azure gives us the advantage of being instantly resilient, scalable, and globally available, and it has several components that we were able to use immediately in our telemetry solution.
Application Insights
Application Insights gives us the ability to monitor sales apps to help us detect and diagnose performance issues and retrieve the most important telemetry data from the sales environment. With Application Insights, we can analyze usage patterns and detect and diagnose performance issues within the sales app stack.
Microsoft Azure Data Factory
Microsoft Azure Data Factory is used to move and transform data. Azure Data Factory (ADF) makes it simple to move data between different sources of telemetry data and the central telemetry repository in Azure Data Lake Storage. We use ADF to transform and analyze incoming telemetry data (from Application Insights blob storage and custom SQL logs, for example) to prepare that data for Data Lake Storage processing and reporting consumption.
Creating the telemetry dataflow
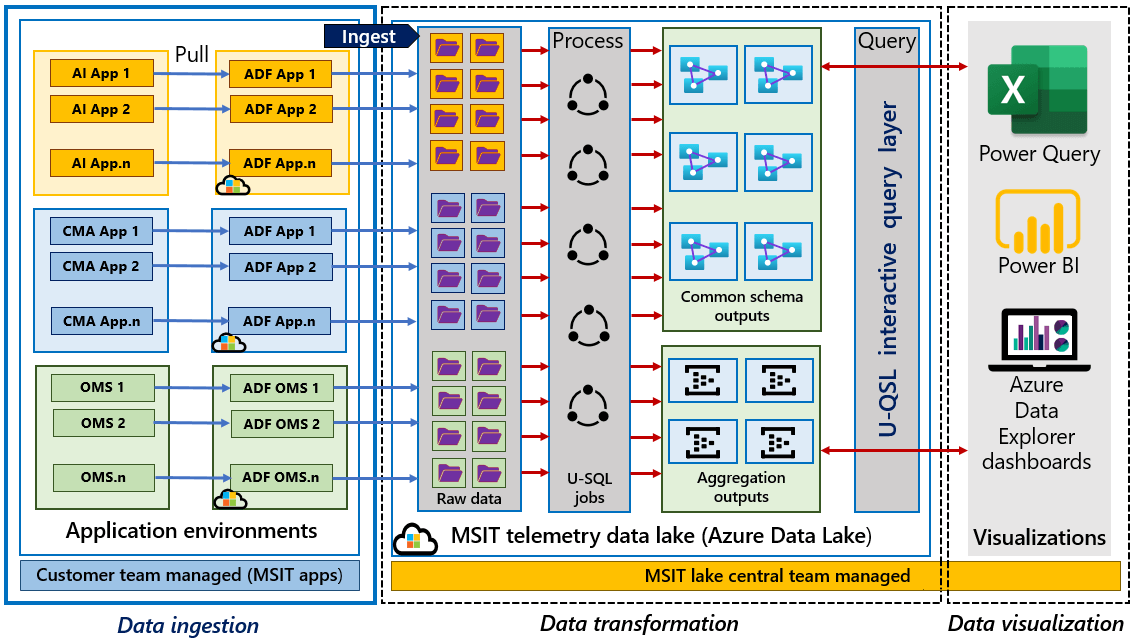
While native telemetry constructs in Azure like Log Analytics and Application Insights can perform telemetry data management, we needed a custom data analytics solution with specialized telemetry and reporting to include our end-to-end business process environment. This solution’s telemetry architecture, represented in the figure below, includes the following components and steps that help to collect and present telemetry data for reporting:
- The telemetry extensions are built into apps or used to mine data from apps that don’t support the extension.
- The data from apps is pulled into Data Factory as raw data. Data Factory passes the data into Data Lake Storage.
- In Data Lake Storage, raw data is converted and transformed by using U-SQL, the native query language for Data Lake Storage, and put into common schema outputs and aggregation outputs.
- The data from these outputs is presented by using U-SQL for consumption by reporting and visualization tools like Microsoft Power Query or Microsoft Power BI.
Providing accessible and meaningful data
We used several solutions to provide meaningful results to different teams across Microsoft. Microsoft Azure App Insights telemetry aggregation provides the core data for our dashboarding. We use Microsoft Azure Data Explorer dashboards for near real-time reporting and Microsoft Power BI dashboards to help our employees to gain deeper insight into their environment. With Power BI, we can create visualizations to represent data and trends in ways previously unavailable. For example, the graphic below depicts data flowing between several apps. The data flow extends beyond a simple app-to-app relationship to encompass the larger business environment and the 13 apps that the chart represents. Visualizations like this help our teams better understand some of the underlying behaviors and trends that affect their business.

Microsoft Azure Data Explorer
Microsoft Azure Data Explorer is a critical tool for near real-time analysis of our data. By using Data Explorer, our engineers can interactively explore and analyze data to troubleshoot issues, monitor infrastructure, and improve app components and customer experience. We use Azure Data Explorer to examine data in place for the Azure environment by using Kusto query language and Azure Data Explorer dashboards. Kusto query language allows our engineers to quickly access views and insights on live data in whatever format they need, while dashboards enable us to instantly save and visualize query results across engineering and user-experience teams.
Establishing a customer-focused culture
Traditional IT has typically focused on making technology work, while business teams do their best to work with the available tools and provide as much value as possible to their customers. With Azure, the extra time and effort we’ve saved by not having to deploy infrastructure and manage a traditional datacenter allows us to dedicate more resources to innovating and improving app development. Business process-focused telemetry can supply customer-focused insights, and we can access those insights by using built-in Azure tools and dashboards instead of building them first.
These development-process changes have taught us that our engineers can and should approach app development from the customer’s perspective. Our tools help employees know their customers and business better—and we learned more about the business and how to make customer-focused decisions during the development process.

We established several best practices while we developed the telemetry solution, including:
- Scalable data storage is key. With telemetry, we’re collecting massive amounts of data. Some data is queried immediately, and some is queried less often or not at all. Regardless of how we use the data, we need a scalable data storage solution to accommodate the large influx of data.
- A common schema is important. Consistent taxonomy makes it much easier to correlate data between apps and establish a consistent telemetry environment that provides a complete picture of business data. However, developing the common schema shouldn’t supersede data collection. It’s much easier to establish the schema and clean up data as it’s ingested, but it’s also possible to begin ingesting whatever telemetry or logging data you have, even if you don’t have a common schema. If the data is there, you can always transform it later.
- Identify the insights that you want to get, then build the visualization. Practical business application is important. Don’t let the format and organization of your data dictate the insights you gain from it. Decide which business insights you want to expose and transform your data and telemetry collection accordingly.
Our telemetry solution for our app portfolio has provided new insights into how we run our business. Using a common schema and telemetry extensions has allowed us to bridge the data gap between our apps and gain a better perspective on our end-to-end business processes. Our employees are better informed and equipped to do their jobs, and we’ve developed a reusable telemetry solution that we can extend to other parts of our business.

- Learn how to use Microsoft Azure Resource Manager for efficient cloud management.
- Discover more on monitoring end-to-end enterprise health with Microsoft Azure.
- See how Microsoft Azure Front Door makes it easy for two apps to boost availability and security.