
This content has been archived, and while it was correct at time of publication, it may no longer be accurate or reflect the current situation at Microsoft.
A big data visualization solution in Microsoft Power BI summarizes and tracks performance against business objectives while Microsoft Digital drives results. This solution refines large amounts of data into accurate and actionable insights for the entire organization. It improves satisfaction, enables growth, and drives operational effectiveness on Microsoft’s road to digital transformation.
At Microsoft Digital (formerly Core Services Engineering and Operations, CSEO), we’ve developed a solution to summarize and track our most important business processes and systems. Our Microsoft Digital Scorecard has transformed the way that we understand and manage our business. We’ve integrated it with our regular processes. It supplies the most definitive source of operational truth for our organization. Taking enormous amounts of system and process data and refining it to supply accurate and actionable information helps us to quickly see how the entire organization is tracking against our business objectives. With the Microsoft Digital Scorecard, we’re improving employee satisfaction, enabling growth, and driving operational effectiveness on our road to digital transformation.
The state of data at Microsoft
At Microsoft, data is everywhere. As we continue our progression to digital transformation, the data our digital systems produce and process borders on overwhelming. Our business processes produce logs and event data ranging from employee satisfaction to financial results to security compliance. At any point, our systems present thousands of individual points of data on running processes. There is no feasible way to represent each of those individual data points and provide a complete view of system process status for our organization. Even when we gathered, aggregated, and summarized important data and information, we lost the salient details in the immense number of averages and medians.
Knowing what data is important presents another challenge to Microsoft’s modern IT organization. Microsoft employs more than 140,000 people. Determining which data is important to our organization as a whole and to our individual business groups is an immense task.
How can we gather and aggregate relevant data? How do we decide which data supplies visibility into our organization’s most critical business processes? How can we better monitor, understand, and manage the way we do business? Our executive leadership asked us these very questions. This paper examines how we addressed them and transformed how we measure and track business outcomes and drive improvement across our organizational goals.
Finding the data that matters most
Our executive leadership came to us looking for better insight into how the Microsoft Digital organization operates. They had a simple request— provide a dashboard that displays the top 35 metrics that demonstrate how well our organization runs. While the request seemed simple enough, fulfilling it was not. Selecting the 35 metrics that properly summarized the thousands of individual metrics that exist within the Microsoft Digital environment was critical. We had to ask ourselves some important questions. Questions like: What are our goals in Microsoft Digital and how are they measured? How do we determine what metrics are the right ones or the most important ones to put on our dashboard? Which metrics will strategically drive our business forward into digital transformation? It was this last question that supplied the direction for assembling what our dashboard might look like.
Making sense of our metrics
We were already collecting a large amount of data throughout Microsoft Digital. Many of our business groups were already using that data to examine their own metrics and create their own dashboards and insights. After examining Microsoft Digital’s dashboards and metrics situations, we found several opportunities for improvement:
- Most business groups only analyzed data and metrics from within their organization. While this makes sense from a departmental perspective, Microsoft Digital’s overall performance depends on all our business groups and how they interact with each other.
- Most dashboards supplied high-level views of data for their respective business groups but couldn’t drill-down into the details. As a result, presenting data usually required pasting the relevant dashboard screenshots and other more detailed reports into a Microsoft PowerPoint slide deck, rather than presenting from the dashboard itself.
- Examining the data required extra steps. In most cases, closer examination of metrics or underlying data required further data manipulation using reporting tools to drill down to specific metrics. As a result, our data analysts couldn’t quickly supply relevant information to our leadership.
- We did not have a single source of truth. If we assembled the different metrics reporting and dashboard solutions being used, they did not combine to supply an accurate and complete idea of what was happening at Microsoft Digital.
We realized that we were going to have to start at the beginning and determine which metrics really mattered when measuring business goals and their key outcomes. Then, we needed to develop a solution to display the data and interact with it in a way that helped our entire business to respond and evolve.
Creating metrics that matter
The most critical aspect to ensuring the success of our entire scorecard solution was creating a view of the metrics that mattered. Since metrics were the heart of the solution, it’s where we started our journey. We worked with leadership and the business units to ensure that we found metrics that could relevantly measure our organization’s business key results, user engagements, service excellence, and compliance.
Working with stakeholders from every part of our organization, we asked for input from the system and process owners who knew what was important within their section of the business. They were our primary means to get metrics defined, collected, reviewed, and finalized through the iterative process illustrated below:
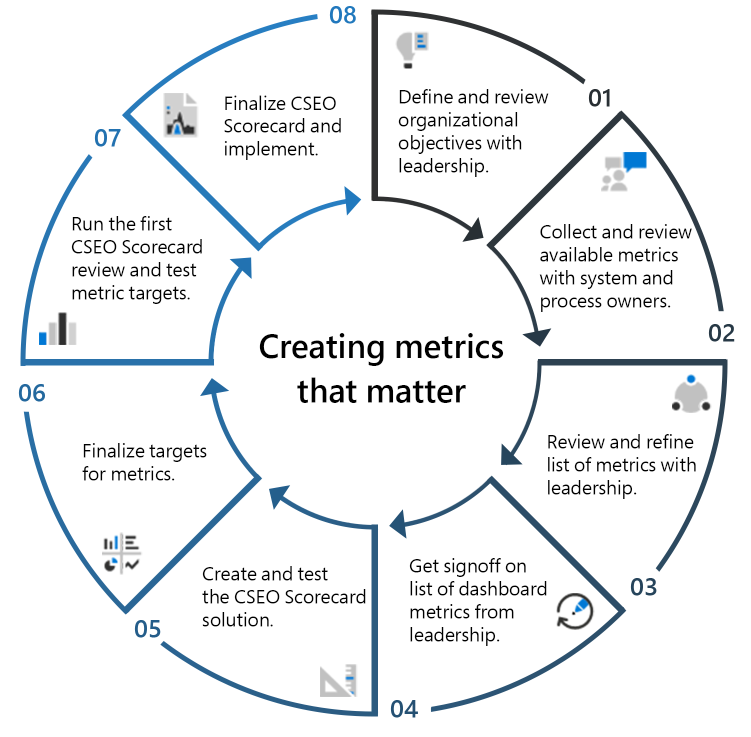
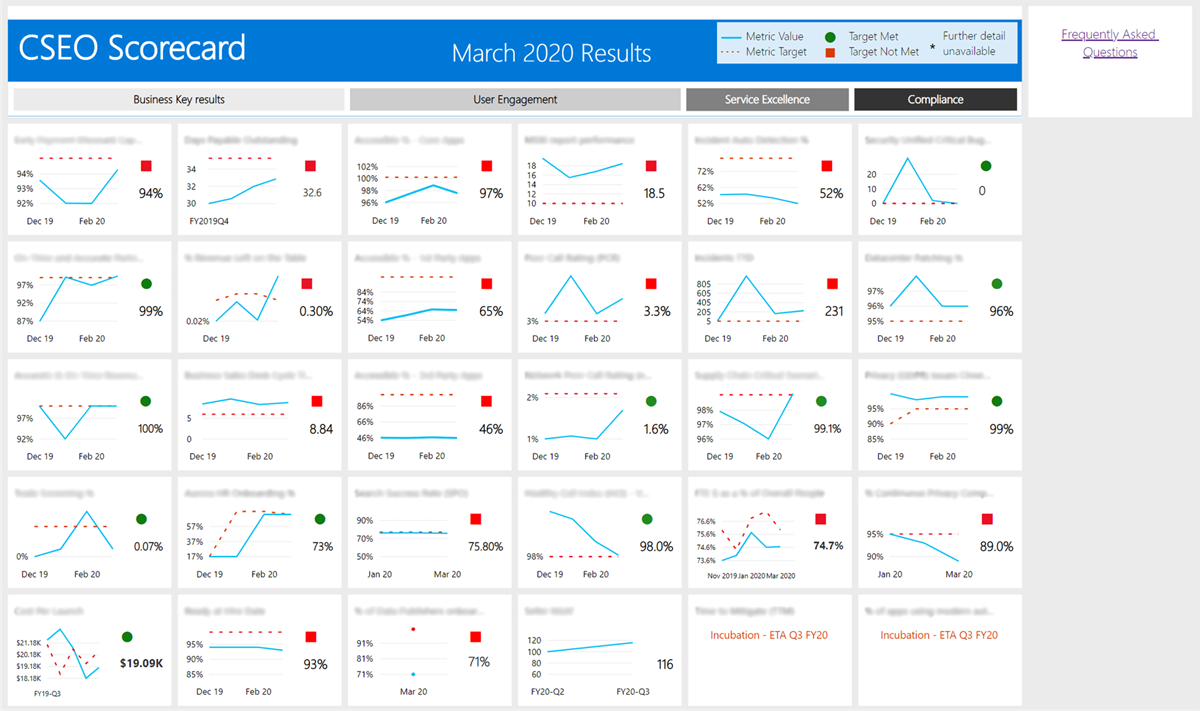
The initial process took us approximately three months to complete. The result was a dashboard and scorecard solution that gave our leadership an accurate and agile view of the entire organization, as shown in Figure 2. Our work to refine and improve the Microsoft Digital Scorecard continues.
Our criteria to select metrics
One of the most important early steps was defining the criteria for our top-level dashboard metrics. We were given a target of 35 metrics that would comprise a complete view of our organization. To determine which metrics would fit on the dashboard, we developed these criteria:
- The metrics must reflect the goals of the organization. We only wanted metrics that would drive us in the direction we wanted to go. We summarized this as data that was important to us and our customers.
- The data presented by the metric must be actionable. If a metric wasn’t performing as we thought it should, we wanted the dashboard to call attention to it and be able to use the data to do something about it.
- The metric must be current and accurate. If the data supporting a metric wasn’t current or didn’t accurately represent the state of our business, it wouldn’t help us. Our high-level business reviews happen monthly, so metrics that update less often than once a quarter weren’t useful to report.
- The metric must be easy to understand with a clear definition. We wanted metrics that were concise and didn’t require further extrapolation or a reference card to explain what they stood for.
- The metric data must be valid for at least one year. Brief trends and small aspects of our business come and go. We wanted a picture of what Microsoft Digital would look like a year from now. This meant capturing the important business data, the things that would last.
- The metric needs to have a clear target for value and timeline. We needed to identify our goals for the metric and determine a timeline for achieving those goals. If we couldn’t establish an accurate timeline to improve an underperforming metric, it didn’t belong on our leadership dashboard.
- The metric must have a single owner. A single owner encompasses three aspects for the data: a single definition of the metric, one way to obtain the data, and one expert to consult on how we could best use the metric on the leadership scorecard.
Establishing metric goals and categories
In addition to the selection criteria, we also worked with the leadership team to establish the high-level reporting goals for the dashboard. Our leadership team wanted a solution that would truly help the business; something we could use to make Microsoft Digital meet its objectives. We produced three primary goals for the dashboard results:
- Improve employee and vendor satisfaction. We wanted to improve the experience of working for and with Microsoft Digital. This meant improving satisfaction for both our employees and our customers.
- Enable growth. Growth speaks for itself. In the IT industry, you can’t stand still. We wanted the dashboard to help us plan for future growth. Knowing that will help us move in the right direction.
- Drive operational effectiveness. Being better is important to Microsoft Digital. Microsoft CEO Satya Nadella has articulated his goal for Microsoft, which is to “empower every person and every organization on the planet to do more and achieve more.” That goal certainly includes our own organization. Operational efficiency is a big part of both that vison and the roots of digital transformation.
When developing the scorecard, we considered the distinct parts of our organization that contribute to the whole. Breaking our organization down into primary business and functional parts enabled us to create usable metric categories. The categories include:
- Business Key results. The Business Key results category measures how we’re doing in Microsoft Digital’s business process. These metrics include:
- Early, on-time, and outstanding payments
- Revenue process
- Business cycle times
- User Engagement. The User Engagement category tell us how our employees, partners, and customers are engaging with our products and services category. These metrics include:
- Accessibility of core, first party, and third-party apps
- Online meetings, calls, and network performance
- Seller sentiment
- Service Excellence. The Service Excellence category tracks our quality and performance in managing our IT operations. These metrics include:
- Incidents and incident auto-detection
- Supply chain critical scenarios
- Employee to vendor ratio
- Compliance. The Compliance category shows us where we stand on compliance, including important areas such as legal compliance and internal policy compliance. These metrics include:
- Incident management (auto-detection and time to detect)
- Service reliability
- Security, privacy, and compliance
Creating the Microsoft Digital Scorecard
After we set our goals and metrics, we used Microsoft Power BI and Microsoft Azure Analysis Services to create the Microsoft Digital Scorecard.
Microsoft Power BI supplies dynamic views of live data
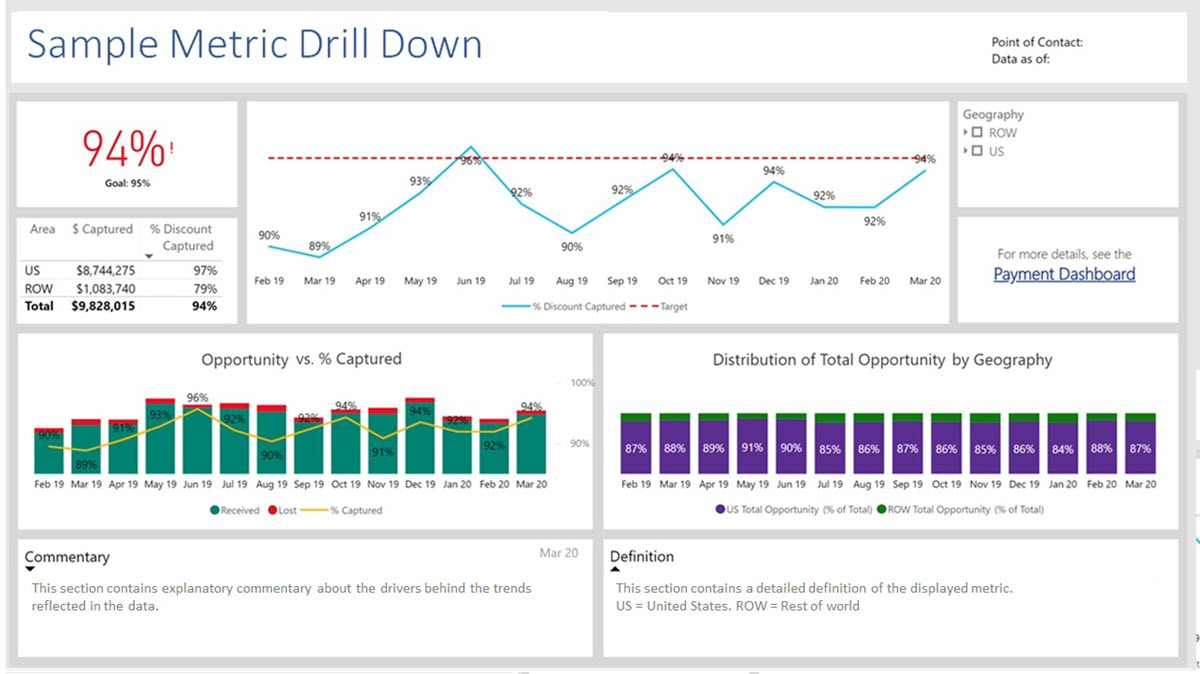
Microsoft Power BI supplied an immediate solution to almost all our high-level solution goals. It supplies dynamic views on live data and, as shown in Figure 3, includes the ability to drill down into more granular, detailed views. It easily integrated with our cloud-based processes and business systems and it was intuitive and easy to begin creating data visualizations. In fact, the ease of the Microsoft Power BI implementation was one of the main reasons we were able to go from idea to solution in three months.
Microsoft Azure Analysis Services for data analytics and modeling
Continuing with the cloud-based nature of Microsoft Digital Scorecard, we used Microsoft Azure Analysis Services for data analytics. Because we pull our data from a huge dataset, we needed to be able to manipulate and represent that data using different models. Microsoft Azure Analysis Services supports the variety of drill-down capabilities we built into the Microsoft Digital Scorecard.
Maintaining a rhythm of business
The Microsoft Digital Scorecard transformed the way we perform our regular organizational review meetings. With the dashboard presenting live data and the ability to drill down to specific metrics and results immediately, we are now able to streamline our monthly review process. Using the scorecard also improved our decision-making process. If a question came up in the review meeting, we no longer needed extra time to run more reports or consult with metric owners. With the Microsoft Digital Scorecard we could expose the necessary data, find the answer to improving our processes, and determine a business direction during the meeting.
We’ve begun establishing a new rhythm of business with the Microsoft Digital Scorecard, with a monthly review and drill down into one of the metrics as core components. By creating a process and rhythm around the Microsoft Digital Scorecard we ensure we have the most relevant, accurate data. The Microsoft Digital Scorecard gives our metric owners time to confirm the results and supply commentary prior to moving into our monthly review meetings.
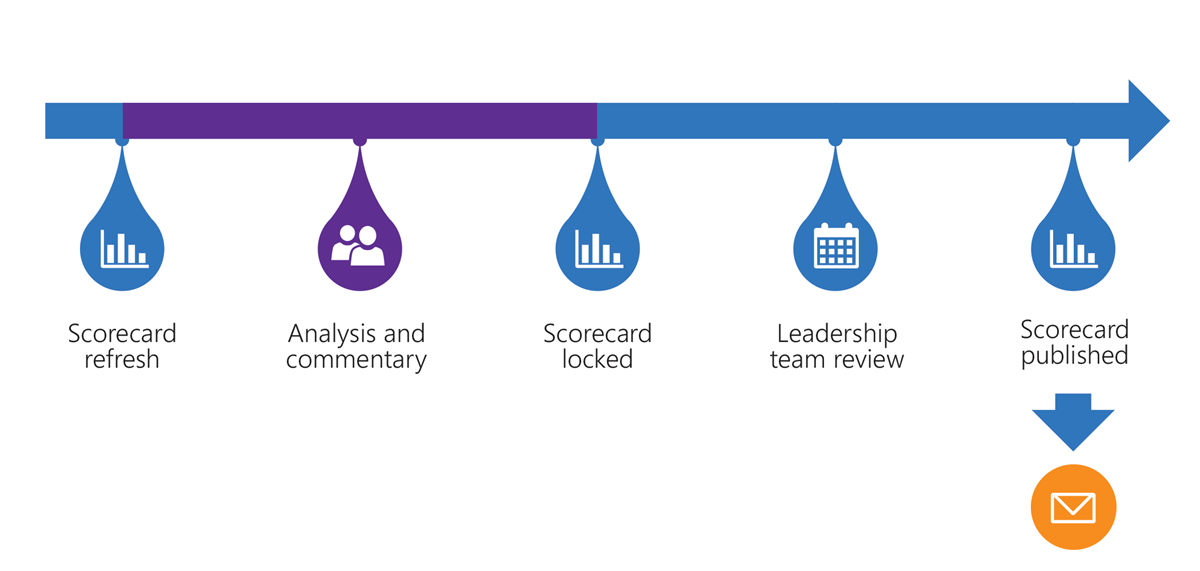
Our Microsoft Digital data analysts work to support the rhythm of business for the Microsoft Digital Scorecard. They create and manage the dashboards in the scorecard, perform the data analysis tasks, and work with the metrics owners to set the business and data standards for Microsoft Digital Scorecard metrics. At a high-level, the monthly rhythm of business looks something like this:
- The first step in the process is a Microsoft Digital Scorecard refresh. The system refreshes and aggregates the data, then it assembles reports. The system then sends initial results to metric owners. The metric owners have 10 days to review the results, ensure accuracy, see highlights and opportunities, and provide feedback in the form of commentary.
- Once the metric owners have reviewed the results and supplied commentary, the data analysts examine the commentary and confirm highlights and opportunities.
- Once the data analysts complete their review, they lock the Microsoft Digital Scorecard in preparation for the monthly review. The final set of highlights and opportunities are available to metric owners, so they can view their business results and prepare.
- After the data analysts lock the Microsoft Digital Scorecard, they send it to the leadership team for monthly review. The leadership team uses the dashboard to assess business performance, determine potential courses of action, and create necessary action items.
- After the monthly review is complete and the leadership team has discussed action items with the owners of the specific metric involved, we publish the scorecard for the rest of the organization to view.
Challenges
We encountered and overcame the following challenges (several times) while assembling the Microsoft Digital Scorecard:
- Too many metrics. The sheer number of metrics and the broad nature of our business meant that it was difficult to select the most important metrics. We initially presented around 80 metrics, considerably more than the 35 asked for. We continued to work with leadership and metric owners, examining and comparing metrics until we could settle on the 31 that appeared on the initial Microsoft Digital Scorecard.
- Maturity in the metrics. Many of our metrics didn’t use complete or correct datasets or were not as updated as we wanted. We had a lot of aspirational targets, but we needed them to be realistic. We worked with metric owners to improve data quality and determine realistic targets for the metrics.
- Overcoming the reluctance to share information and contribute. In some cases, we found metric owners were reluctant to share their metrics. They feared further inspection of their business units. The business culture has shifted. We are working to reframe, through action and our communications, how the organization perceives unfavorable metrics. Data now fuels our digital transformation, rather than being just a measurement of where something is passing or failing. Metrics are indicators of areas that need attention and improvement. We are reinforcing, through our Microsoft Digital Scorecard review, that our goal is not to subject teams to criticism—unfavorable metrics simply reveal opportunities for improvement. This results in the ability to assign resources to address issues, ultimately leaving the metric owner with a better, more efficient process or system.
Benefits
We’re using the Microsoft Digital Scorecard to achieve our primary goals of enabling growth, driving operational effectiveness, and improving satisfaction. The Microsoft Digital Scorecard has allowed us to realize the following benefits within our organization:
- Cost and time savings. We can conduct our monthly review meetings using live data, and we can set goals and plans based on those results right in the meeting. Consequently, we come out of the meeting ready to improve. We don’t need to go back and forth between teams and leadership or obtain follow-up data or information; we do everything in real-time. In addition, we have reduced the time required to prepare for review meetings. We’re reporting using our live dashboard, so there is no need to create additional reports or PowerPoint decks before the meeting. We use the dashboard for everything.
- Rapid quality improvements. The metrics that we use on the dashboard give our leadership team visibility into our business, how we are tracking against our objectives, and which areas might need to improve. This enables us to be quick and efficient when we enact changes. Once we start the plan of action, we can watch the results to ensure that the fix is working.
- Reduced outstanding issues. With the immense level of transparency that the dashboard provides, we can more easily see where processes aren’t working. In six months, we doubled the number of metrics in the dashboard that met or exceeded their threshold.
Moving forward
While the primary goal of the Microsoft Digital Scorecard is moving our organization forward, we’re expecting changes and improvements to the dashboard to supply even more value. These changes include:
- Creating level-2 dashboards for all the business units within our organization. After creating the executive-leadership-level scorecard for the entire Microsoft Digital organization, we started working on creating level-2, or organizational-level, dashboards for each of the business units. Currently, we have level 2 dashboards for 50 percent of the business units and are working on creating dashboards for the rest. Our goal is to supply the same value we realize in our leadership review meetings to the different business units within Microsoft Digital—opportunities for improvement and empowerment to drive efficiencies.
- Continual refinement of collected data. Having monthly reviews, with deep dive focus on a single metric, helps us vet the relevance of the data we are collecting and reveals any data points that might be missing. It is an ongoing process. The Microsoft Digital Scorecard reviews raise the visibility of processes and systems that could benefit from collecting more relevant and actionable data.
Conclusion
The Microsoft Digital Scorecard has transformed the way that Microsoft Digital understands and manages our business. We’ve integrated it into our regular processes, and it supplies the most definitive source of operational truth for our organization. We’ve taken petabytes of system and process data and refined it into a tool that supplies accurate and actionable information to our entire organization. With Microsoft Digital Scorecard, we’re improving satisfaction, enabling growth, and driving operational effectiveness on our road to digital transformation.