Financial Review
ISSUER PURCHASES OF EQUITY SECURITIES, DIVIDENDS, AND STOCK PERFORMANCE
MARKET AND STOCKHOLDERS
Our common stock is traded on the NASDAQ Stock Market under the symbol MSFT. On July 24, 2023, there were 83,883 registered holders of record of our common stock.
SHARE REPURCHASES AND DIVIDENDS
Share Repurchases
On September 18, 2019, our Board of Directors approved a share repurchase program authorizing up to $40.0 billion in share repurchases. This share repurchase program commenced in February 2020 and was completed in November 2021.
On September 14, 2021, our Board of Directors approved a share repurchase program authorizing up to $60.0 billion in share repurchases. This share repurchase program commenced in November 2021, following completion of the program approved on September 18, 2019, has no expiration date, and may be terminated at any time. As of June 30, 2023, $22.3 billion remained of this $60.0 billion share repurchase program.
We repurchased the following shares of common stock under the share repurchase programs:
| (In millions) |
Shares |
|
Amount |
|
Shares |
|
Amount |
|
Shares |
|
Amount |
| Year Ended June 30, |
|
|
2023 |
|
|
|
2022 |
|
|
|
2021 |
| First Quarter |
17 |
|
$ 4,600 |
|
21 |
|
$ 6,200 |
|
25 |
|
$ 5,270 |
| Second Quarter |
20 |
|
4,600 |
|
20 |
|
6,233 |
|
27 |
|
5,750 |
| Third Quarter |
18 |
|
4,600 |
|
26 |
|
7,800 |
|
25 |
|
5,750 |
| Fourth Quarter |
14 |
|
4,600 |
|
28 |
|
7,800 |
|
24 |
|
6,200 |
| Total |
69 |
|
$ 18,400 |
|
95 |
|
$ 28,033 |
|
101 |
|
$ 22,970 |
All repurchases were made using cash resources. Shares repurchased during fiscal year 2023 and the fourth and third quarters of fiscal year 2022 were under the share repurchase program approved on September 14, 2021. Shares repurchased during the second quarter of fiscal year 2022 were under the share repurchase programs approved on both September 14, 2021 and September 18, 2019. All other shares repurchased were under the share repurchase program approved on September 18, 2019. The above table excludes shares repurchased to settle employee tax withholding related to the vesting of stock awards of $3.8 billion, $4.7 billion, and $4.4 billion for fiscal years 2023, 2022, and 2021, respectively.
Dividends
Our Board of Directors declared the following dividends:
| Declaration Date |
Record Date |
Payment Date |
|
Dividend
Per Share |
|
Amount |
| Fiscal Year 2023 |
|
|
|
|
|
(In millions) |
| September 20, 2022 |
November 17, 2022 |
December 8, 2022 |
|
$ 0.68 |
|
$ 5,066 |
| November 29, 2022 |
February 16, 2023 |
March 9, 2023 |
|
0.68 |
|
5,059 |
| March 14, 2023 |
May 18, 2023 |
June 8, 2023 |
|
0.68 |
|
5,054 |
| June 13, 2023 |
August 17, 2023 |
September 14, 2023 |
|
0.68 |
|
5,054 |
| Total |
|
|
|
$ 2.72 |
|
$ 20,233 |
| Fiscal Year 2022 |
|
|
|
|
|
|
| September 14, 2021 |
November 18, 2021 |
December 9, 2021 |
|
$ 0.62 |
|
$ 4,652 |
| December 7, 2021 |
February 17, 2022 |
March 10, 2022 |
|
0.62 |
|
4,645 |
| March 14, 2022 |
May 19, 2022 |
June 9, 2022 |
|
0.62 |
|
4,632 |
| June 14, 2022 |
August 18, 2022 |
September 8, 2022 |
|
0.62 |
|
4,621 |
| Total |
|
|
|
$ 2.48 |
|
$ 18,550 |
The dividend declared on June 13, 2023 was included in other current liabilities as of June 30, 2023.
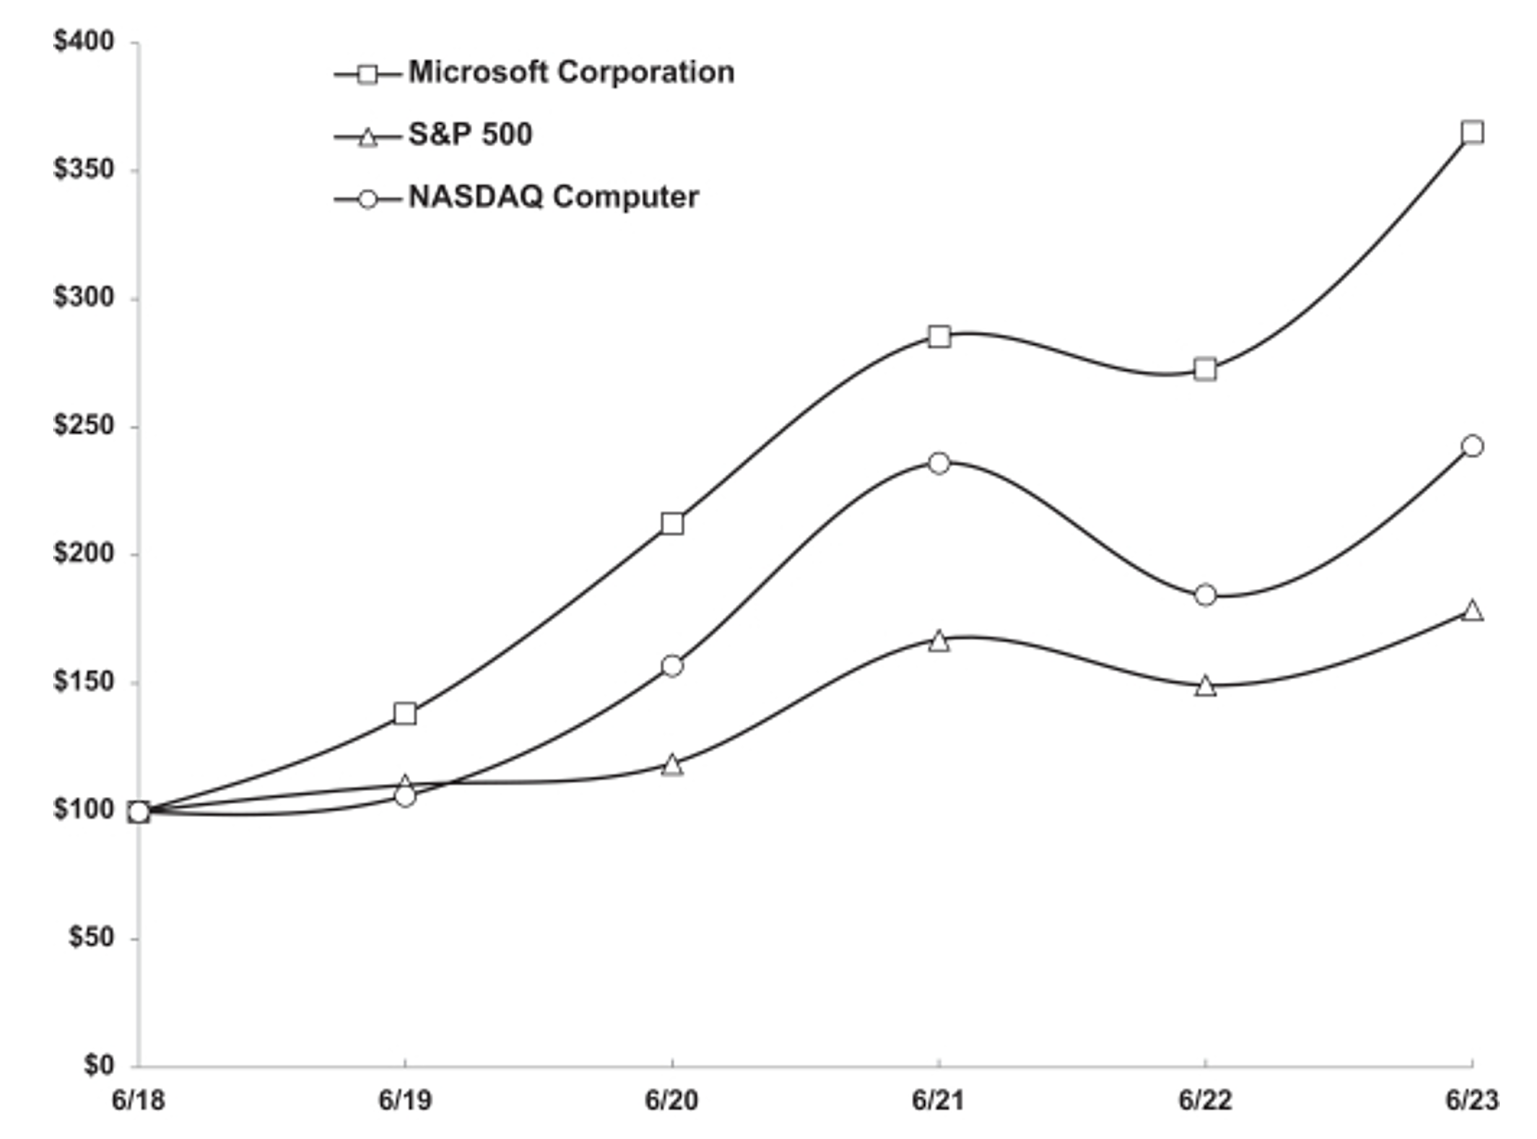
STOCK PERFORMANCE
COMPARISON OF 5 YEAR CUMULATIVE TOTAL RETURN*
Among Microsoft Corporation, the S&P 500 Index and the NASDAQ Computer Index
|
6/18 |
|
6/19 |
|
6/20 |
|
6/21 |
|
6/22 |
|
6/23 |
| Microsoft Corporation |
100.00 |
|
138.07 |
|
212.34 |
|
285.40 |
|
272.82 |
|
365.24 |
| S&P 500 |
100.00 |
|
110.42 |
|
118.70 |
|
167.13 |
|
149.39 |
|
178.66 |
| NASDAQ Computer |
100.00 |
|
106.10 |
|
156.93 |
|
236.08 |
|
184.53 |
|
242.82 |
- $100 invested on 6/30/18 in stock or index, including reinvestment of dividends. Fiscal year ending June 30.
Business
Note About Forward-Looking Statements
This report includes estimates, projections, statements relating to our business plans, objectives, and expected operating results that are “forward-looking statements” within the meaning of the Private Securities Litigation Reform Act of 1995, Section 27A of the Securities Act of 1933, and Section 21E of the Securities Exchange Act of 1934. Forward-looking statements may appear throughout this report, including the following sections: “Business” and “Management’s Discussion and Analysis of Financial Condition and Results of Operations”. These forward-looking statements generally are identified by the words “believe,” “project,” “expect,” “anticipate,” “estimate,” “intend,” “strategy,” “future,” “opportunity,” “plan,” “may,” “should,” “will,” “would,” “will be,” “will continue,” “will likely result,” and similar expressions. Forward-looking statements are based on current expectations and assumptions that are subject to risks and uncertainties that may cause actual results to differ materially. We describe risks and uncertainties that could cause actual results and events to differ materially in “Risk Factors,” “Management’s Discussion and Analysis of Financial Condition and Results of Operations,” and “Quantitative and Qualitative Disclosures about Market Risk” in our fiscal year 2023 Form 10-K. Readers are cautioned not to place undue reliance on forward-looking statements, which speak only as of the date they are made. We undertake no obligation to update or revise publicly any forward-looking statements, whether because of new information, future events, or otherwise.
General
Embracing Our Future
Microsoft is a technology company whose mission is to empower every person and every organization on the planet to achieve more. We strive to create local opportunity, growth, and impact in every country around the world. We are creating the platforms and tools, powered by artificial intelligence (“AI”), that deliver better, faster, and more effective solutions to support small and large business competitiveness, improve educational and health outcomes, grow public-sector efficiency, and empower human ingenuity. From infrastructure and data, to business applications and collaboration, we provide unique, differentiated value to customers.
In a world of increasing economic complexity, AI has the power to revolutionize many types of work. Microsoft is now innovating and expanding our portfolio with AI capabilities to help people and organizations overcome today’s challenges and emerge stronger. Customers are looking to unlock value from their digital spend and innovate for this next generation of AI, while simplifying security and management. Those leveraging the Microsoft Cloud are best positioned to take advantage of technological advancements and drive innovation. Our investment in AI spans the entire company, from Microsoft Teams and Outlook, to Bing and Xbox, and we are infusing generative AI capability into our consumer and commercial offerings to deliver copilot capability for all services across the Microsoft Cloud.
We’re committed to making the promise of AI real – and doing it responsibly. Our work is guided by a core set of principles: fairness, reliability and safety, privacy and security, inclusiveness, transparency, and accountability.
What We Offer
Founded in 1975, we develop and support software, services, devices, and solutions that deliver new value for customers and help people and businesses realize their full potential.
We offer an array of services, including cloud-based solutions that provide customers with software, services, platforms, and content, and we provide solution support and consulting services. We also deliver relevant online advertising to a global audience.
Our products include operating systems, cross-device productivity and collaboration applications, server applications, business solution applications, desktop and server management tools, software development tools, and video games. We also design and sell devices, including PCs, tablets, gaming and entertainment consoles, other intelligent devices, and related accessories.
The Ambitions That Drive Us
To achieve our vision, our research and development efforts focus on three interconnected ambitions:
- Reinvent productivity and business processes.
- Build the intelligent cloud and intelligent edge platform.
- Create more personal computing.
Reinvent Productivity and Business Processes
At Microsoft, we provide technology and resources to help our customers create a secure, productive work environment. Our family of products plays a key role in the ways the world works, learns, and connects.
Our growth depends on securely delivering continuous innovation and advancing our leading productivity and collaboration tools and services, including Office 365, Dynamics 365, and LinkedIn. Microsoft 365 brings together Office 365, Windows, and Enterprise Mobility + Security to help organizations empower their employees with AI-backed tools that unlock creativity, increase collaboration, and fuel innovation, all the while enabling compliance coverage and data protection. Microsoft Teams is a comprehensive platform for work, with meetings, calls, chat, collaboration, and business process automation. Microsoft Viva is an employee experience platform that brings together communications, knowledge, learning, resources, and insights. Microsoft 365 Copilot combines next-generation AI with business data in the Microsoft Graph and Microsoft 365 applications.
Together with the Microsoft Cloud, Dynamics 365, Microsoft Teams, and our AI offerings bring a new era of collaborative applications that optimize business functions, processes, and applications to better serve customers and employees while creating more business value. Microsoft Power Platform is helping domain experts drive productivity gains with low-code/no-code tools, robotic process automation, virtual agents, and business intelligence. In a dynamic labor market, LinkedIn is helping professionals use the platform to connect, learn, grow, and get hired.
Build the Intelligent Cloud and Intelligent Edge Platform
As digital transformation and adoption of AI accelerates and revolutionizes more business workstreams, organizations in every sector across the globe can address challenges that will have a fundamental impact on their success. For enterprises, digital technology empowers employees, optimizes operations, engages customers, and in some cases, changes the very core of products and services. We continue to invest in high performance and sustainable computing to meet the growing demand for fast access to Microsoft services provided by our network of cloud computing infrastructure and datacenters.
Our cloud business benefits from three economies of scale: datacenters that deploy computational resources at significantly lower cost per unit than smaller ones; datacenters that coordinate and aggregate diverse customer, geographic, and application demand patterns, improving the utilization of computing, storage, and network resources; and multi-tenancy locations that lower application maintenance labor costs.
The Microsoft Cloud provides the best integration across the technology stack while offering openness, improving time to value, reducing costs, and increasing agility. Being a global-scale cloud, Azure uniquely offers hybrid consistency, developer productivity, AI capabilities, and trusted security and compliance. We see more emerging use cases and needs for compute and security at the edge and are accelerating our innovation across the spectrum of intelligent edge devices, from Internet of Things (“IoT”) sensors to gateway devices and edge hardware to build, manage, and secure edge workloads.
Our AI platform, Azure AI, is helping organizations transform, bringing intelligence and insights to the hands of their employees and customers to solve their most pressing challenges. Organizations large and small are deploying Azure AI solutions to achieve more at scale, more easily, with the proper enterprise-level and responsible AI protections.
We have a long-term partnership with OpenAI, a leading AI research and deployment company. We deploy OpenAI’s models across our consumer and enterprise products. As OpenAI’s exclusive cloud provider, Azure powers all of OpenAI’s workloads. We have also increased our investments in the development and deployment of specialized supercomputing systems to accelerate OpenAI’s research.
Our hybrid infrastructure offers integrated, end-to-end security, compliance, identity, and management capabilities to support the real-world needs and evolving regulatory requirements of commercial customers and enterprises. Our industry clouds bring together capabilities across the entire Microsoft Cloud, along with industry-specific customizations. Azure Arc simplifies governance and management by delivering a consistent multi-cloud and on-premises management platform.
Nuance, a leader in conversational AI and ambient intelligence across industries including healthcare, financial services, retail, and telecommunications, joined Microsoft in 2022. Microsoft and Nuance enable organizations to accelerate their business goals with security-focused, cloud-based solutions infused with AI.
We are accelerating our development of mixed reality solutions with new Azure services and devices. Microsoft Mesh enables organizations to create custom, immersive experiences for the workplace to help bring remote and hybrid workers and teams together.
The ability to convert data into AI drives our competitive advantage. The Microsoft Intelligent Data Platform is a leading cloud data platform that fully integrates databases, analytics, and governance. The platform empowers organizations to invest more time creating value rather than integrating and managing their data. Microsoft Fabric is an end-to-end, unified analytics platform that brings together all the data and analytics tools that organizations need.
GitHub Copilot is at the forefront of AI-powered software development, giving developers a new tool to write code easier and faster so they can focus on more creative problem-solving. From GitHub to Visual Studio, we provide a developer tool chain for everyone, no matter the technical experience, across all platforms, whether Azure, Windows, or any other cloud or client platform.
Windows also plays a critical role in fueling our cloud business with Windows 365, a desktop operating system that’s also a cloud service. From another internet-connected device, including Android or macOS devices, users can run Windows 365, just like a virtual machine.
Additionally, we are extending our infrastructure beyond the planet, bringing cloud computing to space. Azure Orbital is a fully managed ground station as a service for fast downlinking of data.
Create More Personal Computing
We strive to make computing more personal, enabling users to interact with technology in more intuitive, engaging, and dynamic ways.
Windows 11 offers innovations focused on enhancing productivity, including Windows Copilot with centralized AI assistance and Dev Home to help developers become more productive. Windows 11 security and privacy features include operating system security, application security, and user and identity security.
Through our Search, News, Mapping, and Browser services, Microsoft delivers unique trust, privacy, and safety features. In February 2023, we launched an all new, AI-powered Microsoft Edge browser and Bing search engine with Bing Chat to deliver better search, more complete answers, and the ability to generate content. Microsoft Edge is our fast and secure browser that helps protect users’ data. Quick access to AI-powered tools, apps, and more within Microsoft Edge’s sidebar enhance browsing capabilities.
We are committed to designing and marketing first-party devices to help drive innovation, create new device categories, and stimulate demand in the Windows ecosystem. The Surface family includes Surface Pro, Surface Laptop, and other Surface products.
Microsoft continues to invest in gaming content, community, and cloud services. We have broadened our approach to how we think about gaming end-to-end, from the way games are created and distributed to how they are played, including subscription services like Xbox Game Pass and new devices from third-party manufacturers so players can engage across PC, console, and mobile. In January 2022, we announced plans to acquire Activision Blizzard, Inc., a leader in game development and an interactive entertainment content publisher.
Our Future Opportunity
We are focused on helping customers use the breadth and depth of the Microsoft Cloud to get the most value out of their digital spend while leading the new AI wave across our solution areas. We continue to develop complete, intelligent solutions for our customers that empower people to be productive and collaborate, while safeguarding businesses and simplifying IT management. Our goal is to lead the industry in several distinct areas of technology over the long term, which we expect will translate to sustained growth. We are investing significant resources in:
- Transforming the workplace to deliver new modern, modular business applications, drive deeper insights, and improve how people communicate, collaborate, learn, work, and interact with one another.
- Building and running cloud-based services in ways that utilize ubiquitous computing to unleash new experiences and opportunities for businesses and individuals.
- Applying AI and ambient intelligence to drive insights, revolutionize many types of work, and provide substantive productivity gains using natural methods of communication.
- Tackling security from all angles with our integrated, end-to-end solutions spanning security, compliance, identity, and management, across all clouds and platforms.
- Inventing new gaming experiences that bring people together around their shared love for games on any devices and pushing the boundaries of innovation with console and PC gaming.
- Using Windows to fuel our cloud business, grow our share of the PC market, and drive increased engagement with our services like Microsoft 365 Consumer, Microsoft Teams, Microsoft Edge, Bing, Xbox Game Pass, and more.
Our future growth depends on our ability to transcend current product category definitions, business models, and sales motions.
Corporate Social Responsibility
Commitment to Sustainability
Microsoft’s approach to addressing climate change starts with the sustainability of our own business. In 2020, we committed to being a carbon negative, water positive, and zero waste company by 2030.
In May 2023, we released our Environmental Sustainability Report which looked back at our progress during fiscal year 2022. We continued to make progress on our goals, with our overall emissions declining by 0.5 percent. While our Scope 1 and Scope 2 emissions continued to decline, Scope 3 emissions increased by 0.5 percent. Scope 3 represented 96 percent of our total emissions, resulting primarily from the operations of our suppliers and the use of our products across our customers.
A few examples of our continued progress include:
- Signed new power purchase agreements, bringing our total portfolio of carbon-free energy to over 13.5 gigawatts.
- Contracted for water replenishment projects that are estimated to provide more than 15.6 million cubic meters in volumetric water benefit over the lifetime of these projects.
- Diverted 12,159 metric tons of solid waste from landfills and incinerators across our direct operational footprint.
- Protected 12,270 acres of land in Belize – more than the 11,206 acres of land that we use around the world.
Microsoft has a role to play in developing and advancing new climate solutions, but we recognize that no solution can be offered by any single company, organization, or government. Our approach helps to support the sustainability needs of our customers and the global community. Our Microsoft Cloud for Sustainability, an environmental sustainability management platform that includes Microsoft Sustainability Manager, enables organizations to record, report, and reduce their Scope 1, 2, and 3 emissions. These digital tools can interoperate with business systems and unify data intelligence for organizations.
Addressing Racial Injustice and Inequity
We are committed to addressing racial injustice and inequity in the United States for Black and African American communities and helping improve lived experiences at Microsoft, in employees’ communities, and beyond. Our Racial Equity Initiative focuses on three multi-year pillars, each containing actions and progress we expect to make or exceed by 2025.
- Strengthening our communities: using data, technology, and partnerships to help improve the lives of Black and African American people in the United States, including our employees and their communities.
- Engaging our ecosystem: using our balance sheet and relationships with suppliers and partners to foster societal change and create new opportunities.
- Increasing representation and strengthening inclusion: building on our momentum by adding a $150 million investment to strengthen inclusion and double the number of Black, African American, Hispanic, and Latinx leaders in the United States by 2025.
In fiscal year 2023, we collaborated with partners and worked within neighborhoods and communities to launch and scale a number of projects and programs, including:
- Working with 103 unique organizations in 165 cities and counties on our Justice Reform Initiative to empower communities and advance racial equity and fairness in the justice system.
- Increasing access to affordable broadband, devices, and digital literacy training across 14 geographies, including 11 cities and three states in the Black Rural south.
- Growing our Nonprofit Tech Acceleration for Black and African American Communities program, which uses data, technology, and partnerships to help more than 2,000 local organizations to modernize and streamline operations.
- Expanding our Technology Education and Learning Support (“TEALS”) program to reach nearly 400 high schools in 21 communities to increase computer science opportunities for Black and African American students.
We exceeded our 2020 goal to double the percentage of our transaction volumes with Black- and African American-owned financial institutions by 2023. We are also increasing investment activity with Black- and African American-owned asset managers, which now represent 45 percent of our external manager group, enabling increased funds into local communities. We also met our goal of creating a $100 million program focused on mission-driven banks. We enriched our supplier pipeline, achieving our goal to spend $500 million with double the number of Black- and African American-owned suppliers. We also increased the number of identified partners in the Black Partner Growth Initiative by more than 250 percent, surpassing our initial goal.
We have made meaningful progress on representation and inclusion at Microsoft. As of June 2023, we are 93 percent of the way to our 2025 commitment to double the number of Black and African American people managers in the U.S. (below director level), and 107 percent of the way for Black and African American directors (people managers and individual contributors). We are 28 percent of the way for Hispanic and Latinx people managers (below director level) and 74 percent of the way for Hispanic and Latinx directors.
Investing in Digital Skills
After helping over 80 million jobseekers around the world access digital skilling resources, we introduced a new Skills for Jobs initiative to support a more skills-based labor market, with greater flexibility and accessible learning paths to develop the right skills needed for the most in-demand jobs. Our Skills for Jobs initiative brings together learning resources, certification opportunities, and job-seeker tools from LinkedIn, GitHub, and Microsoft Learn, and is built on data insights drawn from LinkedIn’s Economic Graph.
We also launched a national campaign to help skill and recruit 250,000 people into the cybersecurity workforce by 2025, representing half of the country’s workforce shortage. To that end, we are making curriculum available free of charge to all of the nation’s higher education institutions, providing training for new and existing faculty, and providing scholarships and supplemental resources to 25,000 students. We have expanded the cyber skills initiative to 27 additional countries that show elevated cyberthreat risks coupled with significant gaps in their cybersecurity workforces, partnering with nonprofits and other educational institutions to train the next generation of cybersecurity workers.
Generative AI is creating unparalleled opportunities to empower workers globally, but only if everyone has the skills to use it. To address this, in June 2023 we launched a new AI Skills Initiative to help everyone learn how to harness the power of AI. This includes a new LinkedIn learning pathway offering new coursework on learning the foundations of generative AI. We also launched a new global grant challenge to uncover new ways of training workers on generative AI and are providing greater access to digital learning events and resources for everyone to improve their AI fluency.
HUMAN CAPITAL RESOURCES
Overview
Microsoft aims to recruit, develop, and retain world-changing talent from a diversity of backgrounds. To foster their and our success, we seek to create an environment where people can thrive and do their best work. We strive to maximize the potential of our human capital resources by creating a respectful, rewarding, and inclusive work environment that enables our global employees to create products and services that further our mission.
As of June 30, 2023, we employed approximately 221,000 people on a full-time basis, 120,000 in the U.S. and 101,000 internationally. Of the total employed people, 89,000 were in operations, including manufacturing, distribution, product support, and consulting services; 72,000 were in product research and development; 45,000 were in sales and marketing; and 15,000 were in general and administration. Certain employees are subject to collective bargaining agreements.
Our Culture
Microsoft’s culture is grounded in growth mindset. This means everyone is on a continuous journey to learn and grow, operating as one company instead of multiple siloed businesses.
Our employee listening systems enable us to gather feedback directly from our workforce to inform our programs and employee needs globally. Employees participate in our Employee Signals surveys, which cover a variety of topics such as thriving, inclusion, team culture, wellbeing, and learning and development. We also collect Daily Signals employee survey responses, giving us real-time insights into ways we can support our employees. In addition to Employee Signals and Daily Signals surveys, we gain insights through onboarding, exit surveys, internal Viva Engage channels, employee Q&A sessions, and our internal AskHR Service support.
Diversity and inclusion are core to our business model, and we hold ourselves accountable for driving global systemic change in our workforce and creating an inclusive work environment. We support multiple highly active Employee Resource Groups for women, families, racial and ethnic minorities, military, people with disabilities, and employees who identify as LGBTQIA+, where employees can go for support, networking, and community-building. As described in our 2022 Proxy Statement, annual performance and compensation reviews of our senior leadership team include an evaluation of their contributions to employee culture and diversity. To ensure accountability over time, we publicly disclose our progress on a multitude of workforce metrics including:
- Detailed breakdowns of gender, racial, and ethnic minority representation in our employee population, with data by job types, levels, and segments of our business.
- Our EEO-1 report (equal employment opportunity).
- Disability representation.
- Pay equity (see details below).
Total Rewards and Pay Equity
We develop dynamic, sustainable, market-driven, and strategic programs with the goal of providing a highly differentiated portfolio to attract, reward, and retain top talent and enable our employees to thrive. These programs reinforce our culture and values such as collaboration and growth mindset. Managers evaluate and recommend rewards based on, for example, how well we leverage the work of others and contribute to the success of our colleagues. We monitor pay equity and career progress across multiple dimensions. Our total compensation opportunity is highly differentiated and is market competitive.
In order to manage our costs in a dynamic, competitive environment, in fiscal year 2023 we announced that base salaries of salaried employees would remain at fiscal year 2022 levels. Pay increases continue to be available for rewards-eligible hourly and equivalent employees. We will continue our practice of investing in stock for all rewards-eligible employees, salaried and hourly, and investing in bonuses for all eligible employees.
Since 2016, we have reported on pay equity as part of our annual Diversity and Inclusion report. In 2022, we reported that all racial and ethnic minority employees in the U.S. combined earn $1.008 for every $1.000 earned by their white counterparts, that women in the U.S. earn $1.007 for every $1.000 earned by their counterparts who are men, and that women outside the U.S. earn $1.002 for every $1.000 earned by their counterparts outside the U.S. who are men. In this year’s report, we again expanded our pay equity data beyond the U.S. to report on 61 additional countries (up from 12 last year), representing 99.8% of our global Microsoft workforce.
In addition, we began reporting on unadjusted median pay in our annual report, comparing total pay amounts for all employees regardless of factors such as job title, level, or tenure. For employees who are eligible for rewards, the analysis showed that total pay for women is 89.6% of total pay for men in the U.S. and 86.2% outside of the U.S., and total pay for racial and ethnic minorities in the U.S. is 89.9% of total pay for white employees. As we continue to increase representation for women and racial and ethnic minorities at more senior levels, and continue to ensure pay equity for all, the gap between the medians will reduce.
Our intended result is a global performance and development approach that fosters our culture, and competitive compensation that ensures equitable pay by role while supporting pay for performance.
Wellbeing and Hybrid Work
Microsoft is committed to supporting our employees’ wellbeing while they are at work and in their personal lives. We have invested significantly in wellbeing, and offer a differentiated benefits package which includes many physical, emotional, and financial wellness programs including counseling through the Microsoft CARES Employee Assistance Program, mental wellbeing support, flexible fitness benefits, disability accommodations, savings and investment tools, adoption assistance, and back-up care for children and elders. Finally, our Occupational Health and Safety program helps ensure employees can stay safe while they are working.
We introduced Hybrid Workplace Flexibility Guidance to better support leaders, managers, and employees in hybrid work scenarios. Our ongoing survey data shows that 93% of employees value the flexibility related to work location, work site, and work hours, and 78% are satisfied with the quality of connection with co-workers. There is no one-size-fits-all approach to flexible work at Microsoft. As a company, we will continue to leverage data and research to inform decision making, balancing the needs of business, team, and individual.
Learning and Development
We offer a range of learning opportunities, including personalized opportunities on our internal and external learning portals, in-classroom learning, required learning on compliance and company culture, on-the-job advancement opportunities, and manager coaching. We also provide customized manager learning, new employee orientation, and tools for operating in a flexible hybrid work environment.
All Microsoft employees globally access our single Viva Learning tool for both required and personal choice learning. This includes courses focused on our core principles and compliance matters, such as Business Conduct, Privacy, Security Foundations, and Harassment Prevention. We also deliver skills training for employees based on their profession and role discipline.
We have over 27,000 people managers, all of whom must complete between 20-33 hours of compulsory training on leadership and management and are assigned additional targeted training on an ongoing basis related to people management, compliance, and culture.
OPERATING SEGMENTS
We operate our business and report our financial performance using three segments: Productivity and Business Processes, Intelligent Cloud, and More Personal Computing. Our segments provide management with a comprehensive financial view of our key businesses. The segments enable the alignment of strategies and objectives across the development, sales, marketing, and services organizations, and they provide a framework for timely and rational allocation of resources within businesses.
Additional information on our operating segments and geographic and product information is contained in Note 19 – Segment Information and Geographic Data of the Notes to Financial Statements.
Our reportable segments are described below.
Productivity and Business Processes
Our Productivity and Business Processes segment consists of products and services in our portfolio of productivity, communication, and information services, spanning a variety of devices and platforms. This segment primarily comprises:
- Office Commercial (Office 365 subscriptions, the Office 365 portion of Microsoft 365 Commercial subscriptions, and Office licensed on-premises), comprising Office, Exchange, SharePoint, Microsoft Teams, Office 365 Security and Compliance, Microsoft Viva, and Microsoft 365 Copilot.
- Office Consumer, including Microsoft 365 Consumer subscriptions, Office licensed on-premises, and other Office services.
- LinkedIn, including Talent Solutions, Marketing Solutions, Premium Subscriptions, and Sales Solutions.
- Dynamics business solutions, including Dynamics 365, comprising a set of intelligent, cloud-based applications across ERP, CRM (including Customer Insights), Power Apps, and Power Automate; and on-premises ERP and CRM applications.
Office Commercial
Office Commercial is designed to increase personal, team, and organizational productivity through a range of products and services. Growth depends on our ability to reach new users in new markets such as frontline workers, small and medium businesses, and growth markets, as well as add value to our core product and service offerings to span productivity categories such as communication, collaboration, analytics, security, and compliance. Office Commercial revenue is mainly affected by a combination of continued installed base growth and average revenue per user expansion, as well as the continued shift from Office licensed on-premises to Office 365.
Office Consumer
Office Consumer is designed to increase personal productivity and creativity through a range of products and services. Growth depends on our ability to reach new users, add value to our core product set, and continue to expand our product and service offerings into new markets. Office Consumer revenue is mainly affected by the percentage of customers that buy Office with their new devices and the continued shift from Office licensed on-premises to Microsoft 365 Consumer subscriptions. Office Consumer Services revenue is mainly affected by the demand for communication and storage through Skype, Outlook.com, and OneDrive, which is largely driven by subscriptions, advertising, and the sale of minutes.
LinkedIn
LinkedIn connects the world’s professionals to make them more productive and successful and transforms the way companies hire, market, sell, and learn. Our vision is to create economic opportunity for every member of the global workforce through the ongoing development of the world’s first Economic Graph, a digital representation of the global economy. In addition to LinkedIn’s free services, LinkedIn offers monetized solutions: Talent Solutions, Marketing Solutions, Premium Subscriptions, and Sales Solutions. Talent Solutions provide insights for workforce planning and tools to hire, nurture, and develop talent. Talent Solutions also includes Learning Solutions, which help businesses close critical skills gaps in times where companies are having to do more with existing talent. Marketing Solutions help companies reach, engage, and convert their audiences at scale. Premium Subscriptions enable professionals to manage their professional identity, grow their network, find jobs, and connect with talent through additional services like premium search. Sales Solutions help companies strengthen customer relationships, empower teams with digital selling tools, and acquire new opportunities. LinkedIn has over 950 million members and has offices around the globe. Growth will depend on our ability to increase the number of LinkedIn members and our ability to continue offering services that provide value for our members and increase their engagement. LinkedIn revenue is mainly affected by demand from enterprises and professional organizations for subscriptions to Talent Solutions, Sales Solutions, and Premium Subscriptions offerings, as well as member engagement and the quality of the sponsored content delivered to those members to drive Marketing Solutions.
Dynamics
Dynamics provides cloud-based and on-premises business solutions for financial management, enterprise resource planning (“ERP”), customer relationship management (“CRM”), supply chain management, and other application development platforms for small and medium businesses, large organizations, and divisions of global enterprises. Dynamics revenue is driven by the number of users licensed and applications consumed, expansion of average revenue per user, and the continued shift to Dynamics 365, a unified set of cloud-based intelligent business applications, including Power Apps and Power Automate.
Competition
Competitors to Office include software and global application vendors, such as Apple, Cisco Systems, Meta, Google, Okta, Proofpoint, Slack, Symantec, Zoom, and numerous web-based and mobile application competitors as well as local application developers. Apple distributes versions of its pre-installed application software, such as email and calendar products, through its PCs, tablets, and phones. Cisco Systems is using its position in enterprise communications equipment to grow its unified communications business. Meta offers communication tools to enable productivity and engagement within organizations. Google provides a hosted messaging and productivity suite. Slack provides teamwork and collaboration software. Zoom offers videoconferencing and cloud phone solutions. Okta, Proofpoint, and Symantec provide security solutions across email security, information protection, identity, and governance. Web-based offerings competing with individual applications have also positioned themselves as alternatives to our products and services. We compete by providing powerful, flexible, secure, integrated industry-specific, and easy-to-use productivity and collaboration tools and services that create comprehensive solutions and work well with technologies our customers already have both on-premises or in the cloud.
LinkedIn faces competition from online professional networks, recruiting companies, talent management companies, and larger companies that are focusing on talent management and human resource services; job boards; traditional recruiting firms; and companies that provide learning and development products and services. Marketing Solutions competes with online and offline outlets that generate revenue from advertisers and marketers, and Sales Solutions competes with online and offline outlets for companies with lead generation and customer intelligence and insights.
Dynamics competes with cloud-based and on-premises business solution providers such as Oracle, Salesforce, and SAP.
Intelligent Cloud
Our Intelligent Cloud segment consists of our public, private, and hybrid server products and cloud services that can power modern business and developers. This segment primarily comprises:
- Server products and cloud services, including Azure and other cloud services; SQL Server, Windows Server, Visual Studio, System Center, and related Client Access Licenses (“CALs”); and Nuance and GitHub.
- Enterprise Services, including Enterprise Support Services, Industry Solutions (formerly Microsoft Consulting Services), and Nuance professional services.
Server Products and Cloud Services
Azure is a comprehensive set of cloud services that offer developers, IT professionals, and enterprises freedom to build, deploy, and manage applications on any platform or device. Customers can use Azure through our global network of datacenters for computing, networking, storage, mobile and web application services, AI, IoT, cognitive services, and machine learning. Azure enables customers to devote more resources to development and use of applications that benefit their organizations, rather than managing on-premises hardware and software. Azure revenue is mainly affected by infrastructure-as-a-service and platform-as-a-service consumption-based services, and per user-based services such as Enterprise Mobility + Security.
Azure AI offerings provide a competitive advantage as companies seek ways to optimize and scale their business with machine learning. Azure’s purpose-built, AI-optimized infrastructure allows advanced models, including GPT-4 services designed for developers and data scientists, to do more with less. Customers can integrate large language models and develop the next generation of AI apps and services.
Our server products are designed to make IT professionals, developers, and their systems more productive and efficient. Server software is integrated server infrastructure and middleware designed to support software applications built on the Windows Server operating system. This includes the server platform, database, business intelligence, storage, management and operations, virtualization, service-oriented architecture platform, security, and identity software. We also license standalone and software development lifecycle tools for software architects, developers, testers, and project managers. Server products revenue is mainly affected by purchases through volume licensing programs, licenses sold to original equipment manufacturers (“OEM”), and retail packaged products. CALs provide access rights to certain server products, including SQL Server and Windows Server, and revenue is reported along with the associated server product.
Nuance and GitHub include both cloud and on-premises offerings. Nuance provides healthcare and enterprise AI solutions. GitHub provides a collaboration platform and code hosting service for developers.
Enterprise Services
Enterprise Services, including Enterprise Support Services, Industry Solutions, and Nuance Professional Services, assist customers in developing, deploying, and managing Microsoft server solutions, Microsoft desktop solutions, and Nuance conversational AI and ambient intelligent solutions, along with providing training and certification to developers and IT professionals on various Microsoft products.
Competition
Azure faces diverse competition from companies such as Amazon, Google, IBM, Oracle, VMware, and open source offerings. Azure’s competitive advantage includes enabling a hybrid cloud, allowing deployment of existing datacenters with our public cloud into a single, cohesive infrastructure, and the ability to run at a scale that meets the needs of businesses of all sizes and complexities. Our AI offerings compete with AI products from hyperscalers such as Amazon Bedrock, Amazon CodeWhisperer, and Google AI, as well as products from other emerging competitors, many of which are also current or potential partners, including Meta’s LLaMA2 and other open source solutions. Our Enterprise Mobility + Security offerings also compete with products from a range of competitors including identity vendors, security solution vendors, and numerous other security point solution vendors. We believe our cloud’s global scale, coupled with our broad portfolio of identity and security solutions, allows us to effectively solve complex cybersecurity challenges for our customers and differentiates us from the competition.
Our server products face competition from a wide variety of server operating systems and applications offered by companies with a range of market approaches. Vertically integrated computer manufacturers such as Hewlett-Packard, IBM, and Oracle offer their own versions of the Unix operating system preinstalled on server hardware. Nearly all computer manufacturers offer server hardware for the Linux operating system, and many contribute to Linux operating system development. The competitive position of Linux has also benefited from the large number of compatible applications now produced by many commercial and non-commercial software developers. A number of companies, such as Red Hat, supply versions of Linux.
We compete to provide enterprise-wide computing solutions and point solutions with numerous commercial software vendors that offer solutions and middleware technology platforms, software applications for connectivity (both Internet and intranet), security, hosting, database, and e-business servers. IBM and Oracle lead a group of companies focused on the Java Platform Enterprise Edition that competes with our enterprise-wide computing solutions. Commercial competitors for our server applications for PC-based distributed client-server environments include CA Technologies, IBM, and Oracle. Our web application platform software competes with open source software such as Apache, Linux, MySQL, and PHP. In middleware, we compete against Java vendors.
Our database, business intelligence, and data warehousing solutions offerings compete with products from IBM, Oracle, SAP, Snowflake, and other companies. Our system management solutions compete with server management and server virtualization platform providers, such as BMC, CA Technologies, Hewlett-Packard, IBM, and VMware. Our products for software developers compete against offerings from Adobe, IBM, Oracle, and other companies, and also against open source projects, including Eclipse (sponsored by CA Technologies, IBM, Oracle, and SAP), PHP, and Ruby on Rails.
We believe our server products provide customers with advantages in performance, total costs of ownership, and productivity by delivering superior applications, development tools, compatibility with a broad base of hardware and software applications, security, and manageability.
Our Enterprise Services business competes with a wide range of companies that provide strategy and business planning, application development, and infrastructure services, including multinational consulting firms and small niche businesses focused on specific technologies.
More Personal Computing
Our More Personal Computing segment consists of products and services that put customers at the center of the experience with our technology. This segment primarily comprises:
- Windows, including Windows OEM licensing (“Windows OEM”) and other non-volume licensing of the Windows operating system; Windows Commercial, comprising volume licensing of the Windows operating system, Windows cloud services, and other Windows commercial offerings; patent licensing; and Windows IoT.
- Devices, including Surface, HoloLens, and PC accessories.
- Gaming, including Xbox hardware and Xbox content and services, comprising first- and third-party content (including games and in-game content), Xbox Game Pass and other subscriptions, Xbox Cloud Gaming, advertising, third-party disc royalties, and other cloud services.
- Search and news advertising, comprising Bing (including Bing Chat), Microsoft News, Microsoft Edge, and third-party affiliates.
Windows
The Windows operating system is designed to deliver a more personal computing experience for users by enabling consistency of experience, applications, and information across their devices. Windows OEM revenue is impacted significantly by the number of Windows operating system licenses purchased by OEMs, which they pre-install on the devices they sell. In addition to computing device market volume, Windows OEM revenue is impacted by:
- The mix of computing devices based on form factor and screen size.
- Differences in device market demand between developed markets and growth markets.
- Attachment of Windows to devices shipped.
- Customer mix between consumer, small and medium businesses, and large enterprises.
- Changes in inventory levels in the OEM channel.
- Pricing changes and promotions, pricing variation that occurs when the mix of devices manufactured shifts from local and regional system builders to large multinational OEMs, and different pricing of Windows versions licensed.
- Constraints in the supply chain of device components.
- Piracy.
Windows Commercial revenue, which includes volume licensing of the Windows operating system and Windows cloud services such as Microsoft Defender for Endpoint, is affected mainly by the demand from commercial customers for volume licensing and Software Assurance (“SA”), as well as advanced security offerings. Windows Commercial revenue often reflects the number of information workers in a licensed enterprise and is relatively independent of the number of PCs sold in a given year.
Patent licensing includes our programs to license patents we own for use across a broad array of technology areas, including mobile devices and cloud offerings.
Windows IoT extends the power of Windows and the cloud to intelligent systems by delivering specialized operating systems, tools, and services for use in embedded devices.
Devices
We design and sell devices, including Surface, HoloLens, and PC accessories. Our devices are designed to enable people and organizations to connect to the people and content that matter most using Windows and integrated Microsoft products and services. Surface is designed to help organizations, students, and consumers be more productive. Growth in Devices is dependent on total PC shipments, the ability to attract new customers, our product roadmap, and expanding into new categories.
Gaming
Our gaming platform is designed to provide a variety of entertainment through a unique combination of content, community, and cloud services. Our exclusive game content is created through Xbox Game Studios, a collection of first-party studios creating iconic and differentiated gaming experiences. We continue to invest in new gaming studios and content to expand our intellectual property roadmap and leverage new content creators. These unique gaming experiences are the cornerstone of Xbox Game Pass, a subscription service and gaming community with access to a curated library of over 400 first- and third-party console and PC titles.
The gamer remains at the heart of the Xbox ecosystem. We are identifying new opportunities to attract gamers across a variety of different end points through our first- and third-party content and business diversification across subscriptions, ads, and digital stores. We’ve seen new devices from third-party manufacturers along with key PC and mobile end points that help us empower gamers to play in a way that is most convenient to them. We are focused on growing the platform and expanding to new ecosystems to engage as many gamers as possible.
Xbox enables people to connect and share online gaming experiences that are accessible on Xbox consoles, Windows-enabled devices, and other devices. Xbox is designed to benefit users by providing access to a network of certified applications and services and to benefit our developer and partner ecosystems by providing access to a large customer base. Xbox revenue is mainly affected by subscriptions and sales of first- and third-party content, as well as advertising. Growth of our Gaming business is determined by the overall active user base through Xbox enabled content, availability of games, providing exclusive game content that gamers seek, the computational power and reliability of the devices used to access our content and services, and the ability to create new experiences through first-party content creators.
Search and News Advertising
Our Search and news advertising business is designed to deliver relevant search, native, and display advertising to a global audience. Our Microsoft Edge browser and Bing Chat capabilities are key tools to enable user acquisition and engagement, while our technology platform enables accelerated delivery of digital advertising solutions. In addition to first-party tools, we have several partnerships with companies, such as Yahoo, through which we provide and monetize search offerings. Growth depends on our ability to attract new users, understand intent, and match intent with relevant content on advertising offerings.
Competition
Windows faces competition from various software products and from alternative platforms and devices, mainly from Apple and Google. We believe Windows competes effectively by giving customers choice, value, flexibility, security, an easy-to-use interface, and compatibility with a broad range of hardware and software applications, including those that enable productivity.
Devices face competition from various computer, tablet, and hardware manufacturers who offer a unique combination of high-quality industrial design and innovative technologies across various price points. These manufacturers, many of which are also current or potential partners and customers, include Apple and our Windows OEMs.
Xbox and our cloud gaming services face competition from various online gaming ecosystems and game streaming services, including those operated by Amazon, Apple, Meta, and Tencent. We also compete with other providers of entertainment services such as video streaming platforms. Our gaming platform competes with console platforms from Nintendo and Sony, both of which have a large, established base of customers. We believe our gaming platform is effectively positioned against, and uniquely differentiated from, competitive products and services based on significant innovation in hardware architecture, user interface, developer tools, online gaming and entertainment services, and continued strong exclusive content from our own first-party game franchises as well as other digital content offerings.
Our Search and news advertising business competes with Google and a wide array of websites, social platforms like Meta, and portals that provide content and online offerings to end users.
OPERATIONS
We have regional operations service centers that support our operations, including customer contract and order processing, billing, credit and collections, information processing, and vendor management and logistics. The center in Ireland supports the African, Asia-Pacific, European, and Middle East regions; and the centers in Arlington, Virginia, Atlanta, Georgia, Charlotte, North Carolina, Fargo, North Dakota, Fort Lauderdale, Florida, Redmond, Washington, Reno, Nevada, and Puerto Rico support the American regions.
In addition to our operations centers, we also operate datacenters throughout each of these regions. We continue to identify and evaluate opportunities to expand our datacenter locations and increase our server capacity to meet the evolving needs of our customers, particularly given the growing demand for AI services. Our datacenters depend on the availability of permitted and buildable land, predictable energy, networking supplies, and servers, including graphics processing units (“GPUs”) and other components.
Our devices are primarily manufactured by third-party contract manufacturers. For the majority of our products, we have the ability to use other manufacturers if a current vendor becomes unavailable or unable to meet our requirements. However, some of our products contain certain components for which there are very few qualified suppliers. Extended disruptions at these suppliers could impact our ability to manufacture devices on time to meet consumer demand.
RESEARCH AND DEVELOPMENT
Product and Service Development, and Intellectual Property
We develop most of our products and services internally through the following engineering groups.
- Cloud and AI – focuses on making IT professionals, developers, partners, independent software vendors, and their systems more productive and efficient through development of Azure AI platform and cloud infrastructure, server, database, CRM, ERP, software development tools and services (including GitHub), AI cognitive services, and other business process applications and services for enterprises.
- Strategic Missions and Technologies – focuses on incubating technical products and support solutions with transformative potential for the future of cloud computing and continued company growth across quantum computing, Azure Space & Missions Engineering, telecommunications, and Microsoft Federal Sales and Delivery.
- Experiences and Devices – focuses on delivering high value end-user experiences across our products, services, and devices, including Microsoft 365, Windows, Microsoft Teams, Search (including Microsoft Edge and Bing Chat) and other advertising-based services, and the Surface line of devices.
- Microsoft Security – focuses on delivering a comprehensive portfolio of services that protect our customers’ digital infrastructure through cloud platform and application security, data protection and governance, identity and network access, and device management.
- Technology and Research – focuses on fundamental research, product and business incubations, and forward-looking AI innovations that span infrastructure, services, and applications.
- LinkedIn – focuses on our services that transform the way professionals grow their network and find jobs and the way businesses hire, market, sell, and learn.
- Gaming – focuses on developing hardware, content, and services across a large range of platforms to help grow our user base through game experiences and social interaction.
Internal development allows us to maintain competitive advantages that come from product differentiation and closer technical control over our products and services. It also gives us the freedom to decide which modifications and enhancements are most important and when they should be implemented. We strive to obtain information as early as possible about changing usage patterns and hardware advances that may affect software and hardware design. Before releasing new software platforms, and as we make significant modifications to existing platforms, we provide application vendors with a range of resources and guidelines for development, training, and testing. Generally, we also create product documentation internally.
We protect our intellectual property investments in a variety of ways. We work actively in the U.S. and internationally to ensure the enforcement of copyright, trademark, trade secret, and other protections that apply to our software and hardware products, services, business plans, and branding. We are a leader among technology companies in pursuing patents and currently have a portfolio of over 70,000 U.S. and international patents issued and over 19,000 pending worldwide. While we employ much of our internally-developed intellectual property in our products and services, we also engage in outbound licensing of specific patented technologies that are incorporated into licensees’ products. From time to time, we enter into broader cross-license agreements with other technology companies covering entire groups of patents. We may also purchase or license technology that we incorporate into our products and services. At times, we make select intellectual property broadly available at no or low cost to achieve a strategic objective, such as promoting industry standards, advancing interoperability, supporting societal and/or environmental efforts, or attracting and enabling our external development community. Our increasing engagement with open source software will also cause us to license our intellectual property rights broadly in certain situations.
While it may be necessary in the future to seek or renew licenses relating to various aspects of our products and services, we believe, based upon past experience and industry practice, such licenses generally can be obtained on commercially reasonable terms. We believe our continuing research and product development are not materially dependent on any single license or other agreement with a third party relating to the development of our products.
Investing in the Future
Our success is based on our ability to create new and compelling products, services, and experiences for our users, to initiate and embrace disruptive technology trends, to enter new geographic and product markets, and to drive broad adoption of our products and services. We invest in a range of emerging technology trends and breakthroughs that we believe offer significant opportunities to deliver value to our customers and growth for the company. Based on our assessment of key technology trends, we maintain our long-term commitment to research and development across a wide spectrum of technologies, tools, and platforms spanning digital work and life experiences, cloud computing, AI, devices, and operating systems.
While our main product research and development facilities are located in Redmond, Washington, we also operate research and development facilities in other parts of the U.S. and around the world. This global approach helps us remain competitive in local markets and enables us to continue to attract top talent from across the world.
We plan to continue to make significant investments in a broad range of product research and development activities, and as appropriate we will coordinate our research and development across operating segments and leverage the results across the company.
In addition to our main research and development operations, we also operate Microsoft Research. Microsoft Research is one of the world’s largest corporate research organizations, often working in close collaboration with top universities around the world, and is focused on advancing the state-of-the-art in computer science and a broad range of other disciplines. Our investment in fundamental research provides us a unique perspective on future trends and contributes to our innovation.
DISTRIBUTION, SALES, AND MARKETING
We market and distribute our products and services through the following channels: OEMs, direct, and distributors and resellers. Our sales organization performs a variety of functions, including working directly with commercial enterprises and public-sector organizations worldwide to identify and meet their technology and digital transformation requirements; managing OEM relationships; and supporting system integrators, independent software vendors, and other partners who engage directly with our customers to perform sales, consulting, and fulfillment functions for our products and services.
OEMs
We distribute our products and services through OEMs that pre-install our software on new devices and servers they sell. The largest component of the OEM business is the Windows operating system pre-installed on devices. OEMs also sell devices pre-installed with other Microsoft products and services, including applications such as Office and the capability to subscribe to Office 365.
There are two broad categories of OEMs. The largest category of OEMs are direct OEMs as our relationship with them is managed through a direct agreement between Microsoft and the OEM. We have distribution agreements covering one or more of our products with virtually all the multinational OEMs, including Dell, Hewlett-Packard, Lenovo, and with many regional and local OEMs. The second broad category of OEMs are system builders consisting of lower-volume PC manufacturers, which source Microsoft software for pre-installation and local redistribution primarily through the Microsoft distributor channel rather than through a direct agreement or relationship with Microsoft.
Direct
Many organizations that license our products and services transact directly with us through Enterprise Agreements and Enterprise Services contracts, with sales support from system integrators, independent software vendors, web agencies, and partners that advise organizations on licensing our products and services (“Enterprise Agreement Software Advisors” or “ESA”). Microsoft offers direct sales programs targeted to reach small, medium, and corporate customers, in addition to those offered through the reseller channel. A large network of partner advisors support many of these sales.
We also sell commercial and consumer products and services directly to customers, such as cloud services, search, and gaming, through our digital marketplaces and online stores. Additionally, our Microsoft Experience Centers are designed to facilitate deeper engagement with our partners and customers across industries.
Distributors and Resellers
Organizations also license our products and services indirectly, primarily through licensing solution partners (“LSP”), distributors, value-added resellers (“VAR”), and retailers. Although each type of reselling partner may reach organizations of all sizes, LSPs are primarily engaged with large organizations, distributors resell primarily to VARs, and VARs typically reach small and medium organizations. ESAs are also typically authorized as LSPs and operate as resellers for our other volume licensing programs. Microsoft Cloud Solution Provider is our main partner program for reselling cloud services.
We distribute our retail packaged products primarily through independent non-exclusive distributors, authorized replicators, resellers, and retail outlets. Individual consumers obtain these products primarily through retail outlets. We distribute our devices through third-party retailers. We have a network of field sales representatives and field support personnel that solicit orders from distributors and resellers and provide product training and sales support.
Our Dynamics business solutions are also licensed to enterprises through a global network of channel partners providing vertical solutions and specialized services.
LICENSING OPTIONS
We offer options for organizations that want to purchase our cloud services, on-premises software, and SA. We license software to organizations under volume licensing agreements to allow the customer to acquire multiple licenses of products and services instead of having to acquire separate licenses through retail channels. We use different programs designed to provide flexibility for organizations of various sizes. While these programs may differ in various parts of the world, generally they include those discussed below.
SA conveys rights to new software and upgrades for perpetual licenses released over the contract period. It also provides support, tools, training, and other licensing benefits to help customers deploy and use software efficiently. SA is included with certain volume licensing agreements and is an optional purchase with others.
Volume Licensing Programs
Enterprise Agreement
Enterprise Agreements offer large organizations a manageable volume licensing program that gives them the flexibility to buy cloud services and software licenses under one agreement. Enterprise Agreements are designed for medium or large organizations that want to license cloud services and on-premises software organization-wide over a three-year period. Organizations can elect to purchase perpetual licenses or subscribe to licenses. SA is included.
Microsoft Customer Agreement
A Microsoft Customer Agreement is a simplified purchase agreement presented, accepted, and stored through a digital experience. A Microsoft Customer Agreement is a non-expiring agreement that is designed to support all customers over time, whether purchasing through a partner or directly from Microsoft.
Microsoft Online Subscription Agreement
A Microsoft Online Subscription Agreement is designed for small and medium organizations that want to subscribe to, activate, provision, and maintain cloud services seamlessly and directly via the web. The agreement allows customers to acquire monthly or annual subscriptions for cloud-based services.
Microsoft Products and Services Agreement
Microsoft Products and Services Agreements are designed for medium and large organizations that want to license cloud services and on-premises software as needed, with no organization-wide commitment, under a single, non-expiring agreement. Organizations purchase perpetual licenses or subscribe to licenses. SA is optional for customers that purchase perpetual licenses.
Open Value
Open Value agreements are a simple, cost-effective way to acquire the latest Microsoft technology. These agreements are designed for small and medium organizations that want to license cloud services and on-premises software over a three-year period. Under Open Value agreements, organizations can elect to purchase perpetual licenses or subscribe to licenses and SA is included.
Select Plus
A Select Plus agreement is designed for government and academic organizations to acquire on-premises licenses at any affiliate or department level, while realizing advantages as one organization. Organizations purchase perpetual licenses and SA is optional.
Partner Programs
The Microsoft Cloud Solution Provider Program offers customers an easy way to license the cloud services they need in combination with the value-added services offered by their systems integrator, managed services provider, or cloud reseller partner. Partners in this program can easily package their own products and services to directly provision, manage, and support their customer subscriptions.
The Microsoft Services Provider License Agreement allows hosting service providers and independent software vendors who want to license eligible Microsoft software products to provide software services and hosted applications to their end customers. Partners license software over a three-year period and are billed monthly based on consumption.
The Independent Software Vendor Royalty Program enables partners to integrate Microsoft products into other applications and then license the unified business solution to their end users.
CUSTOMERS
Our customers include individual consumers, small and medium organizations, large global enterprises, public-sector institutions, Internet service providers, application developers, and OEMs. Our practice is to ship our products promptly upon receipt of purchase orders from customers; consequently, backlog is not significant.
AVAILABLE INFORMATION
Our Internet address is www.microsoft.com. At our Investor Relations website, www.microsoft.com/investor, we make available free of charge a variety of information for investors. Our goal is to maintain the Investor Relations website as a portal through which investors can easily find or navigate to pertinent information about us, including:
- Our annual report on Form 10-K, quarterly reports on Form 10-Q, current reports on Form 8-K, and any amendments to those reports, as soon as reasonably practicable after we electronically file that material with or furnish it to the Securities and Exchange Commission (“SEC”) at www.sec.gov.
- Information on our business strategies, financial results, and metrics for investors.
- Announcements of investor conferences, speeches, and events at which our executives talk about our product, service, and competitive strategies. Archives of these events are also available.
- Press releases on quarterly earnings, product and service announcements, legal developments, and international news.
- Corporate governance information including our articles of incorporation, bylaws, governance guidelines, committee charters, codes of conduct and ethics, global corporate social responsibility initiatives, and other governance-related policies.
- Other news and announcements that we may post from time to time that investors might find useful or interesting.
- Opportunities to sign up for email alerts to have information pushed in real time.
We publish a variety of reports and resources related to our Corporate Social Responsibility programs and progress on our Reports Hub website, www.microsoft.com/corporate-responsibility/reports-hub, including reports on sustainability, responsible sourcing, accessibility, digital trust, and public policy engagement.
The information found on these websites is not part of, or incorporated by reference into, this or any other report we file with, or furnish to, the SEC. In addition to these channels, we use social media to communicate to the public. It is possible that the information we post on social media could be deemed to be material to investors. We encourage investors, the media, and others interested in Microsoft to review the information we post on the social media channels listed on our Investor Relations website.
Discussion & Analysis
MANAGEMENT’S DISCUSSION AND ANALYSIS OF FINANCIAL CONDITION AND RESULTS OF OPERATIONS
The following Management’s Discussion and Analysis of Financial Condition and Results of Operations (“MD&A”) is intended to help the reader understand the results of operations and financial condition of Microsoft Corporation. MD&A is provided as a supplement to, and should be read in conjunction with, our consolidated financial statements and the accompanying Notes to Financial Statements. This section generally discusses the results of our operations for the year ended June 30, 2023 compared to the year ended June 30, 2022. For a discussion of the year ended June 30, 2022 compared to the year ended June 30, 2021, please refer to, “Management’s Discussion and Analysis of Financial Condition and Results of Operations” in our Annual Report on Form 10-K for the year ended June 30, 2022.
OVERVIEW
Microsoft is a technology company whose mission is to empower every person and every organization on the planet to achieve more. We strive to create local opportunity, growth, and impact in every country around the world. We are creating the platforms and tools, powered by artificial intelligence (“AI”), that deliver better, faster, and more effective solutions to support small and large business competitiveness, improve educational and health outcomes, grow public-sector efficiency, and empower human ingenuity.
We generate revenue by offering a wide range of cloud-based solutions, content, and other services to people and businesses; licensing and supporting an array of software products; delivering relevant online advertising to a global audience; and designing and selling devices. Our most significant expenses are related to compensating employees; supporting and investing in our cloud-based services, including datacenter operations; designing, manufacturing, marketing, and selling our other products and services; and income taxes.
Highlights from fiscal year 2023 compared with fiscal year 2022 included:
- Microsoft Cloud revenue increased 22% to $111.6 billion.
- Office Commercial products and cloud services revenue increased 10% driven by Office 365 Commercial growth of 13%.
- Office Consumer products and cloud services revenue increased 2% and Microsoft 365 Consumer subscribers increased to 67.0 million.
- LinkedIn revenue increased 10%.
- Dynamics products and cloud services revenue increased 16% driven by Dynamics 365 growth of 24%.
- Server products and cloud services revenue increased 19% driven by Azure and other cloud services growth of 29%.
- Windows original equipment manufacturer licensing (“Windows OEM”) revenue decreased 25%.
- Devices revenue decreased 24%.
- Windows Commercial products and cloud services revenue increased 5%.
- Xbox content and services revenue decreased 3%.
- Search and news advertising revenue excluding traffic acquisition costs increased 11%.
Industry Trends
Our industry is dynamic and highly competitive, with frequent changes in both technologies and business models. Each industry shift is an opportunity to conceive new products, new technologies, or new ideas that can further transform the industry and our business. At Microsoft, we push the boundaries of what is possible through a broad range of research and development activities that seek to identify and address the changing demands of customers and users, industry trends, and competitive forces.
Economic Conditions, Challenges, and Risks
The markets for software, devices, and cloud-based services are dynamic and highly competitive. Our competitors are developing new software and devices, while also deploying competing cloud-based services for consumers and businesses. The devices and form factors customers prefer evolve rapidly, influencing how users access services in the cloud and, in some cases, the user’s choice of which suite of cloud-based services to use. Aggregate demand for our software, services, and devices is also correlated to global macroeconomic and geopolitical factors, which remain dynamic. We must continue to evolve and adapt over an extended time in pace with this changing environment.
The investments we are making in cloud and AI infrastructure and devices will continue to increase our operating costs and may decrease our operating margins. We continue to identify and evaluate opportunities to expand our datacenter locations and increase our server capacity to meet the evolving needs of our customers, particularly given the growing demand for AI services. Our datacenters depend on the availability of permitted and buildable land, predictable energy, networking supplies, and servers, including graphics processing units (“GPUs”) and other components. Our devices are primarily manufactured by third-party contract manufacturers. For the majority of our products, we have the ability to use other manufacturers if a current vendor becomes unavailable or unable to meet our requirements. However, some of our products contain certain components for which there are very few qualified suppliers. Extended disruptions at these suppliers could impact our ability to manufacture devices on time to meet consumer demand.
Our success is highly dependent on our ability to attract and retain qualified employees. We hire a mix of university and industry talent worldwide. We compete for talented individuals globally by offering an exceptional working environment, broad customer reach, scale in resources, the ability to grow one’s career across many different products and businesses, and competitive compensation and benefits.
Our international operations provide a significant portion of our total revenue and expenses. Many of these revenue and expenses are denominated in currencies other than the U.S. dollar. As a result, changes in foreign exchange rates may significantly affect revenue and expenses. Fluctuations in the U.S. dollar relative to certain foreign currencies reduced reported revenue and expenses from our international operations in fiscal year 2023.
On January 18, 2023, we announced decisions we made to align our cost structure with our revenue and customer demand, prioritize our investments in strategic areas, and consolidate office space. As a result, we recorded a $1.2 billion charge in the second quarter of fiscal year 2023 (“Q2 charge”), which included employee severance expenses of $800 million, impairment charges resulting from changes to our hardware portfolio, and costs related to lease consolidation activities. First, we reduced our overall workforce by approximately 10,000 jobs through the third quarter of fiscal year 2023 related to the Q2 charge, which represents less than 5% of our total employee base. While we eliminated roles in some areas, we will continue to hire in key strategic areas. Second, we are allocating both our capital and talent to areas of secular growth and long-term competitiveness, while divesting in other areas. Third, we are consolidating our leases to create higher density across our workspaces, which impacted our financial results through the remainder of fiscal year 2023, and we may make similar decisions in future periods as we continue to evaluate our real estate needs.
Refer to Risk Factors in our fiscal year 2023 Form 10-K for a discussion of these factors and other risks.
Seasonality
Our revenue fluctuates quarterly and is generally higher in the second and fourth quarters of our fiscal year. Second quarter revenue is driven by corporate year-end spending trends in our major markets and holiday season spending by consumers, and fourth quarter revenue is driven by the volume of multi-year on-premises contracts executed during the period.
Change in Accounting Estimate
In July 2022, we completed an assessment of the useful lives of our server and network equipment. Due to investments in software that increased efficiencies in how we operate our server and network equipment, as well as advances in technology, we determined we should increase the estimated useful lives of both server and network equipment from four years to six years. This change in accounting estimate was effective beginning fiscal year 2023. Based on the carrying amount of server and network equipment included in property and equipment, net as of June 30, 2022, the effect of this change in estimate for fiscal year 2023 was an increase in operating income of $3.7 billion and net income of $3.0 billion, or $0.40 per both basic and diluted share.
Reportable Segments
We report our financial performance based on the following segments: Productivity and Business Processes, Intelligent Cloud, and More Personal Computing. The segment amounts included in MD&A are presented on a basis consistent with our internal management reporting. We have recast certain prior period amounts to conform to the way we internally manage and monitor our business.
Additional information on our reportable segments is contained in Note 19 – Segment Information and Geographic Data of the Notes to Financial Statements.
Metrics
We use metrics in assessing the performance of our business and to make informed decisions regarding the allocation of resources. We disclose metrics to enable investors to evaluate progress against our ambitions, provide transparency into performance trends, and reflect the continued evolution of our products and services. Our commercial and other business metrics are fundamentally connected based on how customers use our products and services. The metrics are disclosed in the MD&A or the Notes to Financial Statements. Financial metrics are calculated based on financial results prepared in accordance with accounting principles generally accepted in the United States of America (“GAAP”), and growth comparisons relate to the corresponding period of last fiscal year.
In the first quarter of fiscal year 2023, we made updates to the presentation and method of calculation for certain metrics, most notably expanding our Surface metric into a broader Devices metric to incorporate additional revenue streams, along with other minor changes to align with how we manage our businesses.
Commercial
Our commercial business primarily consists of Server products and cloud services, Office Commercial, Windows Commercial, the commercial portion of LinkedIn, Enterprise Services, and Dynamics. Our commercial metrics allow management and investors to assess the overall health of our commercial business and include leading indicators of future performance.
Commercial remaining performance obligation |
Commercial portion of revenue allocated to remaining performance obligations, which includes unearned revenue and amounts that will be invoiced and recognized as revenue in future periods |
Microsoft Cloud revenue |
Revenue from Azure and other cloud services, Office 365 Commercial, the commercial portion of LinkedIn, Dynamics 365, and other commercial cloud properties |
Microsoft Cloud gross margin percentage |
Gross margin percentage for our Microsoft Cloud business |
Productivity and Business Processes and Intelligent Cloud
Metrics related to our Productivity and Business Processes and Intelligent Cloud segments assess the health of our core businesses within these segments. The metrics reflect our cloud and on-premises product strategies and trends.
Office Commercial products and cloud services revenue growth |
Revenue from Office Commercial products and cloud services (Office 365 subscriptions, the Office 365 portion of Microsoft 365 Commercial subscriptions, and Office licensed on-premises), comprising Office, Exchange, SharePoint, Microsoft Teams, Office 365 Security and Compliance, Microsoft Viva, and Microsoft 365 Copilot |
Office Consumer products and cloud services revenue growth |
Revenue from Office Consumer products and cloud services, including Microsoft 365 Consumer subscriptions, Office licensed on-premises, and other Office services |
Office 365 Commercial seat growth |
The number of Office 365 Commercial seats at end of period where seats are paid users covered by an Office 365 Commercial subscription |
Microsoft 365 Consumer subscribers |
The number of Microsoft 365 Consumer subscribers at end of period |
Dynamics products and cloud services revenue growth |
Revenue from Dynamics products and cloud services, including Dynamics 365, comprising a set of intelligent, cloud-based applications across ERP, CRM (including Customer Insights), Power Apps, and Power Automate; and on-premises ERP and CRM applications |
LinkedIn revenue growth |
Revenue from LinkedIn, including Talent Solutions, Marketing Solutions, Premium Subscriptions, and Sales Solutions |
Server products and cloud services revenue growth |
Revenue from Server products and cloud services, including Azure and other cloud services; SQL Server, Windows Server, Visual Studio, System Center, and related Client Access Licenses (“CALs”); and Nuance and GitHub |
More Personal Computing
Metrics related to our More Personal Computing segment assess the performance of key lines of business within this segment. These metrics provide strategic product insights which allow us to assess the performance across our commercial and consumer businesses. As we have diversity of target audiences and sales motions within the Windows business, we monitor metrics that are reflective of those varying motions.
Windows OEM revenue growth |
Revenue from sales of Windows Pro and non-Pro licenses sold through the OEM channel |
Windows Commercial products and cloud
services revenue growth |
Revenue from Windows Commercial products and cloud services, comprising volume licensing of the Windows operating system, Windows cloud services, and other Windows commercial offerings |
Devices revenue growth |
Revenue from Devices, including Surface, HoloLens, and PC accessories |
Xbox content and services revenue growth |
Revenue from Xbox content and services, comprising first- and third-party content (including games and in-game content), Xbox Game Pass and other subscriptions, Xbox Cloud Gaming, advertising, third-party disc royalties, and other cloud services |
Search and news advertising revenue (ex TAC)
growth |
Revenue from search and news advertising excluding traffic acquisition costs (“TAC”) paid to Bing Ads network publishers and news partners |
SUMMARY RESULTS OF OPERATIONS
| (In millions, except percentages and per share amounts) |
2023 |
2022 |
Percentage
Change |
| Revenue |
$ 211,915 |
$ 198,270 |
7% |
| Gross margin |
146,052 |
135,620 |
8% |
| Operating income |
88,523 |
83,383 |
6% |
| Net income |
72,361 |
72,738 |
(1)% |
| Diluted earnings per share |
9.68 |
9.65 |
0% |
| Adjusted gross margin (non-GAAP) |
146,204 |
135,620 |
8% |
| Adjusted operating income (non-GAAP) |
89,694 |
83,383 |
8% |
| Adjusted net income (non-GAAP) |
73,307 |
69,447 |
6% |
| Adjusted diluted earnings per share (non-GAAP) |
9.81 |
9.21 |
7% |
Adjusted gross margin, operating income, net income, and diluted earnings per share (“EPS”) are non-GAAP financial measures. Current year non-GAAP financial measures exclude the impact of the Q2 charge, which includes employee severance expenses, impairment charges resulting from changes to our hardware portfolio, and costs related to lease consolidation activities. Prior year non-GAAP financial measures exclude the net income tax benefit related to transfer of intangible properties in the first quarter of fiscal year 2022. Refer to Note 12 – Income Taxes of the Notes to Financial Statements for further discussion. Refer to the Non-GAAP Financial Measures section below for a reconciliation of our financial results reported in accordance with GAAP to non-GAAP financial results.
Fiscal Year 2023 Compared with Fiscal Year 2022
Revenue increased $13.6 billion or 7% driven by growth in Intelligent Cloud and Productivity and Business Processes, offset in part by a decline in More Personal Computing. Intelligent Cloud revenue increased driven by Azure and other cloud services. Productivity and Business Processes revenue increased driven by Office 365 Commercial and LinkedIn. More Personal Computing revenue decreased driven by Windows and Devices.
Cost of revenue increased $3.2 billion or 5% driven by growth in Microsoft Cloud, offset in part by the change in accounting estimate.
Gross margin increased $10.4 billion or 8% driven by growth in Intelligent Cloud and Productivity and Business Processes and the change in accounting estimate, offset in part by a decline in More Personal Computing.
- Gross margin percentage increased slightly. Excluding the impact of the change in accounting estimate, gross margin percentage decreased 1 point driven by declines in Intelligent Cloud and More Personal Computing, offset in part by sales mix shift between our segments.
- Microsoft Cloud gross margin percentage increased 2 points to 72%. Excluding the impact of the change in accounting estimate, Microsoft Cloud gross margin percentage decreased slightly driven by a decline in Azure and other cloud services and sales mix shift to Azure and other cloud services, offset in part by improvement in Office 365 Commercial.
Operating expenses increased $5.3 billion or 10% driven by employee severance expenses, 2 points of growth from the Nuance and Xandr acquisitions, investments in cloud engineering, and LinkedIn.
Operating income increased $5.1 billion or 6% driven by growth in Productivity and Business Processes and Intelligent Cloud and the change in accounting estimate, offset in part by a decline in More Personal Computing.
Revenue, gross margin, and operating income included an unfavorable foreign currency impact of 4%, 4%, and 6%, respectively. Cost of revenue and operating expenses both included a favorable foreign currency impact of 2%.
Current year gross margin, operating income, net income, and diluted EPS were negatively impacted by the Q2 charge, which resulted in decreases of $152 million, $1.2 billion, $946 million, and $0.13, respectively. Prior year net income and diluted EPS were positively impacted by the net tax benefit related to the transfer of intangible properties, which resulted in an increase to net income and diluted EPS of $3.3 billion and $0.44, respectively.
SEGMENT RESULTS OF OPERATIONS
| (In millions, except percentages) |
2023 |
|
2022 |
Percentage
Change |
| Revenue |
|
|
|
|
| Productivity and Business Processes |
$ 69,274 |
|
$ 63,364 |
9% |
| Intelligent Cloud |
87,907 |
|
74,965 |
17% |
| More Personal Computing |
54,734 |
|
59,941 |
(9)% |
| Total |
$ 211,915 |
|
$ 198,270 |
7% |
| Operating Income |
|
|
|
|
| Productivity and Business Processes |
$ 34,189 |
|
$ 29,690 |
15% |
| Intelligent Cloud |
37,884 |
|
33,203 |
14% |
| More Personal Computing |
16,450 |
|
20,490 |
(20)% |
| Total |
$ 88,523 |
|
$ 83,383 |
6% |
Reportable Segments
Fiscal Year 2023 Compared with Fiscal Year 2022
Productivity and Business Processes
Revenue increased $5.9 billion or 9%.
- Office Commercial products and cloud services revenue increased $3.7 billion or 10%. Office 365 Commercial revenue grew 13% with seat growth of 11%, driven by small and medium business and frontline worker offerings, as well as growth in revenue per user. Office Commercial products revenue declined 21% driven by continued customer shift to cloud offerings.
- Office Consumer products and cloud services revenue increased $140 million or 2%. Microsoft 365 Consumer subscribers grew 12% to 67.0 million.
- LinkedIn revenue increased $1.3 billion or 10% driven by Talent Solutions.
- Dynamics products and cloud services revenue increased $750 million or 16% driven by Dynamics 365 growth of 24%.
Operating income increased $4.5 billion or 15%.
- Gross margin increased $5.8 billion or 12% driven by growth in Office 365 Commercial and LinkedIn, as well as the change in accounting estimate. Gross margin percentage increased. Excluding the impact of the change in accounting estimate, gross margin percentage increased slightly driven by improvement in Office 365 Commercial, offset in part by sales mix shift to cloud offerings.
- Operating expenses increased $1.3 billion or 7% driven by investment in LinkedIn and employee severance expenses.
Revenue, gross margin, and operating income included an unfavorable foreign currency impact of 5%, 5%, and 8%, respectively.
Intelligent Cloud
Revenue increased $12.9 billion or 17%.
- Server products and cloud services revenue increased $12.6 billion or 19% driven by Azure and other cloud services. Azure and other cloud services revenue grew 29% driven by growth in our consumption-based services. Server products revenue decreased 1%.
- Enterprise Services revenue increased $315 million or 4% driven by growth in Enterprise Support Services, offset in part by a decline in Industry Solutions (formerly Microsoft Consulting Services).
Operating income increased $4.7 billion or 14%.
- Gross margin increased $8.9 billion or 17% driven by growth in Azure and other cloud services and the change in accounting estimate. Gross margin percentage decreased slightly. Excluding the impact of the change in accounting estimate, gross margin percentage decreased 3 points driven by sales mix shift to Azure and other cloud services and a decline in Azure and other cloud services.
- Operating expenses increased $4.2 billion or 21% driven by investments in Azure, 4 points of growth from the Nuance acquisition, and employee severance expenses.
Revenue, gross margin, and operating income included an unfavorable foreign currency impact of 4%, 4%, and 6%, respectively. Operating expenses included a favorable foreign currency impact of 2%.
More Personal Computing
Revenue decreased $5.2 billion or 9%.
- Windows revenue decreased $3.2 billion or 13% driven by a decrease in Windows OEM. Windows OEM revenue decreased 25% as elevated channel inventory levels continued to drive additional weakness beyond declining PC demand. Windows Commercial products and cloud services revenue increased 5% driven by demand for Microsoft 365.
- Devices revenue decreased $1.8 billion or 24% as elevated channel inventory levels continued to drive additional weakness beyond declining PC demand.
- Gaming revenue decreased $764 million or 5% driven by declines in Xbox hardware and Xbox content and services. Xbox hardware revenue decreased 11% driven by lower volume and price of consoles sold. Xbox content and services revenue decreased 3% driven by a decline in first-party content, offset in part by growth in Xbox Game Pass.
- Search and news advertising revenue increased $617 million or 5%. Search and news advertising revenue excluding traffic acquisition costs increased 11% driven by higher search volume and the Xandr acquisition.
Operating income decreased $4.0 billion or 20%.
- Gross margin decreased $4.2 billion or 13% driven by declines in Windows and Devices. Gross margin percentage decreased driven by a decline in Devices.
- Operating expenses decreased $195 million or 2% driven by a decline in Devices, offset in part by investments in Search and news advertising, including 2 points of growth from the Xandr acquisition.
Revenue, gross margin, and operating income included an unfavorable foreign currency impact of 3%, 4%, and 6%, respectively. Operating expenses included a favorable foreign currency impact of 2%.
OPERATING EXPENSES
Research and Development
| (In millions, except percentages) |
2023 |
2022 |
Percentage
Change |
| Research and development |
$ 27,195 |
$ 24,512 |
11% |
| As a percent of revenue |
13% |
12% |
1ppt |
Research and development expenses include payroll, employee benefits, stock-based compensation expense, and other headcount-related expenses associated with product development. Research and development expenses also include third-party development and programming costs and the amortization of purchased software code and services content.
Fiscal Year 2023 Compared with Fiscal Year 2022
Research and development expenses increased $2.7 billion or 11% driven by investments in cloud engineering and LinkedIn.
Sales and Marketing
| (In millions, except percentages) |
2023 |
2022 |
Percentage
Change |
| Sales and marketing |
$ 22,759 |
$ 21,825 |
4% |
| As a percent of revenue |
11% |
11% |
0ppt |
Sales and marketing expenses include payroll, employee benefits, stock-based compensation expense, and other headcount-related expenses associated with sales and marketing personnel, and the costs of advertising, promotions, trade shows, seminars, and other programs.
Fiscal Year 2023 Compared with Fiscal Year 2022
Sales and marketing expenses increased $934 million or 4% driven by 3 points of growth from the Nuance and Xandr acquisitions and investments in commercial sales, offset in part by a decline in Windows advertising. Sales and marketing included a favorable foreign currency impact of 2%.
General and Administrative
| (In millions, except percentages) |
2023 |
2022 |
Percentage
Change |
| General and administrative |
$ 7,575 |
$ 5,900 |
28% |
| As a percent of revenue |
4% |
3% |
1ppt |
General and administrative expenses include payroll, employee benefits, stock-based compensation expense, employee severance expense incurred as part of a corporate program, and other headcount-related expenses associated with finance, legal, facilities, certain human resources and other administrative personnel, certain taxes, and legal and other administrative fees.
Fiscal Year 2023 Compared with Fiscal Year 2022
General and administrative expenses increased $1.7 billion or 28% driven by employee severance expenses and a charge related to a non-public preliminary draft decision provided by the Irish Data Protection Commission. General and administrative included a favorable foreign currency impact of 2%.
OTHER INCOME (EXPENSE), NET
The components of other income (expense), net were as follows:
| (In millions) |
|
|
|
| Year Ended June 30, |
2023 |
|
2022 |
| Interest and dividends income |
$ 2,994 |
|
$ 2,094 |
| Interest expense |
(1,968) |
|
(2,063) |
| Net recognized gains on investments |
260 |
|
461 |
| Net losses on derivatives |
(456) |
|
(52) |
| Net gains (losses) on foreign currency remeasurements |
181 |
|
(75) |
| Other, net |
(223) |
|
(32) |
| Total |
$ 788 |
|
$ 333 |
We use derivative instruments to manage risks related to foreign currencies, equity prices, interest rates, and credit; enhance investment returns; and facilitate portfolio diversification. Gains and losses from changes in fair values of derivatives that are not designated as hedging instruments are primarily recognized in other income (expense), net.
Fiscal Year 2023 Compared with Fiscal Year 2022
Interest and dividends income increased due to higher yields, offset in part by lower portfolio balances. Interest expense decreased due to a decrease in outstanding long-term debt due to debt maturities. Net recognized gains on investments decreased due to lower gains on equity securities and higher losses on fixed income securities. Net losses on derivatives increased due to losses related to managing strategic investments.
INCOME TAXES
Effective Tax Rate
Our effective tax rate for fiscal years 2023 and 2022 was 19% and 13%, respectively. The increase in our effective tax rate was primarily due to a $3.3 billion net income tax benefit in the first quarter of fiscal year 2022 related to the transfer of intangible properties and a decrease in tax benefits relating to stock-based compensation.
In the first quarter of fiscal year 2022, we transferred certain intangible properties from our Puerto Rico subsidiary to the U.S. The transfer of intangible properties resulted in a $3.3 billion net income tax benefit in the first quarter of fiscal year 2022, as the value of future U.S. tax deductions exceeded the current tax liability from the U.S. global intangible low-taxed income tax.
Our effective tax rate was lower than the U.S. federal statutory rate, primarily due to earnings taxed at lower rates in foreign jurisdictions resulting from producing and distributing our products and services through our foreign regional operations center in Ireland.
The mix of income before income taxes between the U.S. and foreign countries impacted our effective tax rate as a result of the geographic distribution of, and customer demand for, our products and services. In fiscal year 2023, our U.S. income before income taxes was $52.9 billion and our foreign income before income taxes was $36.4 billion. In fiscal year 2022, our U.S. income before income taxes was $47.8 billion and our foreign income before income taxes was $35.9 billion.
Uncertain Tax Positions
We settled a portion of the Internal Revenue Service (“IRS”) audit for tax years 2004 to 2006 in fiscal year 2011. In February 2012, the IRS withdrew its 2011 Revenue Agents Report related to unresolved issues for tax years 2004 to 2006 and reopened the audit phase of the examination. We also settled a portion of the IRS audit for tax years 2007 to 2009 in fiscal year 2016, and a portion of the IRS audit for tax years 2010 to 2013 in fiscal year 2018. In the second quarter of fiscal year 2021, we settled an additional portion of the IRS audits for tax years 2004 to 2013 and made a payment of $1.7 billion, including tax and interest. We remain under audit for tax years 2004 to 2017.
As of June 30, 2023, the primary unresolved issues for the IRS audits relate to transfer pricing, which could have a material impact in our consolidated financial statements when the matters are resolved. We believe our allowances for income tax contingencies are adequate. We have not received a proposed assessment for the unresolved key transfer pricing issues. We do not expect a final resolution of these issues in the next 12 months. Based on the information currently available, we do not anticipate a significant increase or decrease to our tax contingencies for these issues within the next 12 months.
We are subject to income tax in many jurisdictions outside the U.S. Our operations in certain jurisdictions remain subject to examination for tax years 1996 to 2022, some of which are currently under audit by local tax authorities. The resolution of each of these audits is not expected to be material to our consolidated financial statements.
NON-GAAP FINANCIAL MEASURES
Adjusted gross margin, operating income, net income, and diluted EPS are non-GAAP financial measures. Current year non-GAAP financial measures exclude the impact of the Q2 charge, which includes employee severance expenses, impairment charges resulting from changes to our hardware portfolio, and costs related to lease consolidation activities. Prior year non-GAAP financial measures exclude the net income tax benefit related to transfer of intangible properties in the first quarter of fiscal year 2022. We believe these non-GAAP measures aid investors by providing additional insight into our operational performance and help clarify trends affecting our business. For comparability of reporting, management considers non-GAAP measures in conjunction with GAAP financial results in evaluating business performance. These non-GAAP financial measures presented should not be considered a substitute for, or superior to, the measures of financial performance prepared in accordance with GAAP.
The following table reconciles our financial results reported in accordance with GAAP to non-GAAP financial results:
| (In millions, except percentages and per share amounts) |
2023 |
|
2022 |
Percentage
Change |
| Gross margin |
$ 146,052 |
|
$ 135,620 |
8% |
| Severance, hardware-related impairment, and lease consolidation costs |
152 |
|
0 |
* |
| Adjusted gross margin (non-GAAP) |
$ 146,204 |
|
$ 135,620 |
8% |
| Operating income |
$ 88,523 |
|
$ 83,383 |
6% |
| Severance, hardware-related impairment, and lease consolidation costs |
1,171 |
|
0 |
* |
| Adjusted operating income (non-GAAP) |
$ 89,694 |
|
$ 83,383 |
8% |
| Net income |
$ 72,361 |
|
$ 72,738 |
(1)% |
| Severance, hardware-related impairment, and lease consolidation costs |
946 |
|
0 |
* |
| Net income tax benefit related to transfer of intangible properties |
0 |
|
(3,291) |
* |
| Adjusted net income (non-GAAP) |
$ 73,307 |
|
$ 69,447 |
6% |
| Diluted earnings per share |
$ 9.68 |
|
$ 9.65 |
0% |
| Severance, hardware-related impairment, and lease consolidation costs |
0.13 |
|
0 |
* |
| Net income tax benefit related to transfer of intangible properties |
0 |
|
(0.44) |
* |
| Adjusted diluted earnings per share (non-GAAP) |
$ 9.81 |
|
$ 9.21 |
7% |
- Not meaningful.
LIQUIDITY AND CAPITAL RESOURCES
We expect existing cash, cash equivalents, short-term investments, cash flows from operations, and access to capital markets to continue to be sufficient to fund our operating activities and cash commitments for investing and financing activities, such as dividends, share repurchases, debt maturities, material capital expenditures, and the transition tax related to the Tax Cuts and Jobs Act (“TCJA”), for at least the next 12 months and thereafter for the foreseeable future.
Cash, Cash Equivalents, and Investments
Cash, cash equivalents, and short-term investments totaled $111.3 billion and $104.8 billion as of June 30, 2023 and 2022, respectively. Equity investments were $9.9 billion and $6.9 billion as of June 30, 2023 and 2022, respectively. Our short-term investments are primarily intended to facilitate liquidity and capital preservation. They consist predominantly of highly liquid investment-grade fixed-income securities, diversified among industries and individual issuers. The investments are predominantly U.S. dollar-denominated securities, but also include foreign currency-denominated securities to diversify risk. Our fixed-income investments are exposed to interest rate risk and credit risk. The credit risk and average maturity of our fixed-income portfolio are managed to achieve economic returns that correlate to certain fixed-income indices. The settlement risk related to these investments is insignificant given that the short-term investments held are primarily highly liquid investment-grade fixed-income securities.
Valuation
In general, and where applicable, we use quoted prices in active markets for identical assets or liabilities to determine the fair value of our financial instruments. This pricing methodology applies to our Level 1 investments, such as U.S. government securities, common and preferred stock, and mutual funds. If quoted prices in active markets for identical assets or liabilities are not available to determine fair value, then we use quoted prices for similar assets and liabilities or inputs other than the quoted prices that are observable either directly or indirectly. This pricing methodology applies to our Level 2 investments, such as commercial paper, certificates of deposit, U.S. agency securities, foreign government bonds, mortgage- and asset-backed securities, corporate notes and bonds, and municipal securities. Level 3 investments are valued using internally-developed models with unobservable inputs. Assets and liabilities measured at fair value on a recurring basis using unobservable inputs are an immaterial portion of our portfolio.
A majority of our investments are priced by pricing vendors and are generally Level 1 or Level 2 investments as these vendors either provide a quoted market price in an active market or use observable inputs for their pricing without applying significant adjustments. Broker pricing is used mainly when a quoted price is not available, the investment is not priced by our pricing vendors, or when a broker price is more reflective of fair values in the market in which the investment trades. Our broker-priced investments are generally classified as Level 2 investments because the broker prices these investments based on similar assets without applying significant adjustments. In addition, all our broker-priced investments have a sufficient level of trading volume to demonstrate that the fair values used are appropriate for these investments. Our fair value processes include controls that are designed to ensure appropriate fair values are recorded. These controls include model validation, review of key model inputs, analysis of period-over-period fluctuations, and independent recalculation of prices where appropriate.
Cash Flows
Cash from operations decreased $1.5 billion to $87.6 billion for fiscal year 2023, mainly due to an increase in cash paid to employees and suppliers and cash used to pay income taxes, offset in part by an increase in cash received from customers. Cash used in financing decreased $14.9 billion to $43.9 billion for fiscal year 2023, mainly due to a $10.5 billion decrease in common stock repurchases and a $6.3 billion decrease in repayments of debt, offset in part by a $1.7 billion increase in dividends paid. Cash used in investing decreased $7.6 billion to $22.7 billion for fiscal year 2023, due to a $20.4 billion decrease in cash used for acquisitions of companies, net of cash acquired, and purchases of intangible and other assets, offset in part by a $8.2 billion decrease in cash from net investment purchases, sales, and maturities, and a $4.2 billion increase in additions to property and equipment.
Debt Proceeds
We issue debt to take advantage of favorable pricing and liquidity in the debt markets, reflecting our credit rating and the low interest rate environment. The proceeds of these issuances were or will be used for general corporate purposes, which may include, among other things, funding for working capital, capital expenditures, repurchases of capital stock, acquisitions, and repayment of existing debt. Refer to Note 11 – Debt of the Notes to Financial Statements for further discussion.
Unearned Revenue
Unearned revenue comprises mainly unearned revenue related to volume licensing programs, which may include Software Assurance (“SA”) and cloud services. Unearned revenue is generally invoiced annually at the beginning of each contract period for multi-year agreements and recognized ratably over the coverage period. Unearned revenue also includes payments for other offerings for which we have been paid in advance and earn the revenue when we transfer control of the product or service. Refer to Note 1 – Accounting Policies of the Notes to Financial Statements for further discussion.
The following table outlines the expected future recognition of unearned revenue as of June 30, 2023:
| (In millions) |
|
| Three Months Ending |
|
| September 30, 2023 |
$ 19,673 |
| December 31, 2023 |
15,600 |
| March 31, 2024 |
10,801 |
| June 30, 2024 |
4,827 |
| Thereafter |
2,912 |
| Total |
$53,813 |
If our customers choose to license cloud-based versions of our products and services rather than licensing transaction-based products and services, the associated revenue will shift from being recognized at the time of the transaction to being recognized over the subscription period or upon consumption, as applicable. Refer to Note 13 – Unearned Revenue of the Notes to Financial Statements for further discussion.
Material Cash Requirements and Other Obligations
Contractual Obligations
The following table summarizes the payments due by fiscal year for our outstanding contractual obligations as of June 30, 2023:
| (In millions) |
2024 |
|
Thereafter |
|
Total |
| Long-term debt: (a) |
|
|
|
|
|
| Principal payments |
$ 5,250 |
|
$ 47,616 |
|
$ 52,866 |
| Interest payments |
1,379 |
|
19,746 |
|
21,125 |
| Construction commitments (b) |
12,237 |
|
1,218 |
|
13,455 |
| Operating and finance leases, including imputed interest (c) |
5,988 |
|
73,852 |
|
79,840 |
| Purchase commitments (d) |
64,703 |
|
3,115 |
|
67,818 |
| Total |
$ 89,557 |
|
$ 145,547 |
|
$ 235,104 |
- Refer to Note 11 – Debt of the Notes to Financial Statements.
- Refer to Note 7 – Property and Equipment of the Notes to Financial Statements.
- Refer to Note 14 – Leases of the Notes to Financial Statements.
- Purchase commitments primarily relate to datacenters and include open purchase orders and take-or-pay contracts that are not presented as construction commitments above.
Income Taxes
As a result of the TCJA, we are required to pay a one-time transition tax on deferred foreign income not previously subject to U.S. income tax. Under the TCJA, the transition tax is payable in interest-free installments over eight years, with 8% due in each of the first five years, 15% in year six, 20% in year seven, and 25% in year eight. We have paid transition tax of $7.7 billion, which included $1.5 billion for fiscal year 2023. The remaining transition tax of $10.5 billion is payable over the next three years, with $2.7 billion payable within 12 months.
In fiscal year 2023, we paid cash tax of $4.8 billion due to the mandatory capitalization for tax purposes of research and development expenditures enacted by the TCJA and effective on July 1, 2022.
Share Repurchases
During fiscal years 2023 and 2022, we repurchased 69 million shares and 95 million shares of our common stock for $18.4 billion and $28.0 billion, respectively, through our share repurchase programs. All repurchases were made using cash resources. As of June 30, 2023, $22.3 billion remained of our $60 billion share repurchase program. Refer to Note 16 – Stockholders’ Equity of the Notes to Financial Statements for further discussion.
Dividends
During fiscal year 2023 and 2022, our Board of Directors declared quarterly dividends of $0.68 per share and $0.62 per share, totaling $20.2 billion and $18.6 billion, respectively. We intend to continue returning capital to shareholders in the form of dividends, subject to declaration by our Board of Directors. Refer to Note 16 – Stockholders’ Equity of the Notes to Financial Statements for further discussion.
Other Planned Uses of Capital
On January 18, 2022, we entered into a definitive agreement to acquire Activision Blizzard, Inc. (“Activision Blizzard”) for $95.00 per share in an all-cash transaction valued at $68.7 billion, inclusive of Activision Blizzard’s net cash. The acquisition has been approved by Activision Blizzard’s shareholders. We continue to work toward closing the transaction subject to obtaining required regulatory approvals and satisfaction of other customary closing conditions. Microsoft and Activision Blizzard have jointly agreed to extend the merger agreement through October 18, 2023 to allow for additional time to resolve remaining regulatory concerns.
We will continue to invest in sales, marketing, product support infrastructure, and existing and advanced areas of technology, as well as acquisitions that align with our business strategy. Additions to property and equipment will continue, including new facilities, datacenters, and computer systems for research and development, sales and marketing, support, and administrative staff. We expect capital expenditures to increase in coming years to support growth in our cloud offerings and our investments in AI infrastructure. We have operating and finance leases for datacenters, corporate offices, research and development facilities, Microsoft Experience Centers, and certain equipment. We have not engaged in any related party transactions or arrangements with unconsolidated entities or other persons that are reasonably likely to materially affect liquidity or the availability of capital resources.
CRITICAL ACCOUNTING ESTIMATES
Our consolidated financial statements and accompanying notes are prepared in accordance with GAAP. Preparing consolidated financial statements requires management to make estimates and assumptions that affect the reported amounts of assets, liabilities, revenue, and expenses. Critical accounting estimates are those estimates that involve a significant level of estimation uncertainty and could have a material impact on our financial condition or results of operations. We have critical accounting estimates in the areas of revenue recognition, impairment of investment securities, goodwill, research and development costs, legal and other contingencies, income taxes, and inventories.
Revenue Recognition
Our contracts with customers often include promises to transfer multiple products and services to a customer. Determining whether products and services are considered distinct performance obligations that should be accounted for separately versus together may require significant judgment. When a cloud-based service includes both on-premises software licenses and cloud services, judgment is required to determine whether the software license is considered distinct and accounted for separately, or not distinct and accounted for together with the cloud service and recognized over time. Certain cloud services, primarily Office 365, depend on a significant level of integration, interdependency, and interrelation between the desktop applications and cloud services, and are accounted for together as one performance obligation. Revenue from Office 365 is recognized ratably over the period in which the cloud services are provided.
Judgment is required to determine the stand-alone selling price (“SSP”) for each distinct performance obligation. We use a single amount to estimate SSP for items that are not sold separately, including on-premises licenses sold with SA or software updates provided at no additional charge. We use a range of amounts to estimate SSP when we sell each of the products and services separately and need to determine whether there is a discount to be allocated based on the relative SSP of the various products and services.
In instances where SSP is not directly observable, such as when we do not sell the product or service separately, we determine the SSP using information that may include market conditions and other observable inputs. We typically have more than one SSP for individual products and services due to the stratification of those products and services by customers and circumstances. In these instances, we may use information such as the size of the customer and geographic region in determining the SSP.
Due to the various benefits from and the nature of our SA program, judgment is required to assess the pattern of delivery, including the exercise pattern of certain benefits across our portfolio of customers.
Our products are generally sold with a right of return, we may provide other credits or incentives, and in certain instances we estimate customer usage of our products and services, which are accounted for as variable consideration when determining the amount of revenue to recognize. Returns and credits are estimated at contract inception and updated at the end of each reporting period if additional information becomes available. Changes to our estimated variable consideration were not material for the periods presented.
Impairment of Investment Securities
We review debt investments quarterly for credit losses and impairment. If the cost of an investment exceeds its fair value, we evaluate, among other factors, general market conditions, credit quality of debt instrument issuers, and the extent to which the fair value is less than cost. This determination requires significant judgment. In making this judgment, we employ a systematic methodology that considers available quantitative and qualitative evidence in evaluating potential impairment of our investments. In addition, we consider specific adverse conditions related to the financial health of, and business outlook for, the investee. If we have plans to sell the security or it is more likely than not that we will be required to sell the security before recovery, then a decline in fair value below cost is recorded as an impairment charge in other income (expense), net and a new cost basis in the investment is established. If market, industry, and/or investee conditions deteriorate, we may incur future impairments.
Equity investments without readily determinable fair values are written down to fair value if a qualitative assessment indicates that the investment is impaired and the fair value of the investment is less than carrying value. We perform a qualitative assessment on a periodic basis. We are required to estimate the fair value of the investment to determine the amount of the impairment loss. Once an investment is determined to be impaired, an impairment charge is recorded in other income (expense), net.
Goodwill
We allocate goodwill to reporting units based on the reporting unit expected to benefit from the business combination. We evaluate our reporting units on an annual basis and, if necessary, reassign goodwill using a relative fair value allocation approach. Goodwill is tested for impairment at the reporting unit level (operating segment or one level below an operating segment) on an annual basis (May 1) and between annual tests if an event occurs or circumstances change that would more likely than not reduce the fair value of a reporting unit below its carrying value. These events or circumstances could include a significant change in the business climate, legal factors, operating performance indicators, competition, or sale or disposition of a significant portion of a reporting unit.
Application of the goodwill impairment test requires judgment, including the identification of reporting units, assignment of assets and liabilities to reporting units, assignment of goodwill to reporting units, and determination of the fair value of each reporting unit. The fair value of each reporting unit is estimated primarily through the use of a discounted cash flow methodology. This analysis requires significant judgments, including estimation of future cash flows, which is dependent on internal forecasts, estimation of the long-term rate of growth for our business, estimation of the useful life over which cash flows will occur, and determination of our weighted average cost of capital.
The estimates used to calculate the fair value of a reporting unit change from year to year based on operating results, market conditions, and other factors. Changes in these estimates and assumptions could materially affect the determination of fair value and goodwill impairment for each reporting unit.
Research and Development Costs
Costs incurred internally in researching and developing a computer software product are charged to expense until technological feasibility has been established for the product. Once technological feasibility is established, software costs are capitalized until the product is available for general release to customers. Judgment is required in determining when technological feasibility of a product is established. We have determined that technological feasibility for our software products is reached after all high-risk development issues have been resolved through coding and testing. Generally, this occurs shortly before the products are released to production. The amortization of these costs is included in cost of revenue over the estimated life of the products.
Legal and Other Contingencies
The outcomes of legal proceedings and claims brought against us are subject to significant uncertainty. An estimated loss from a loss contingency such as a legal proceeding or claim is accrued by a charge to income if it is probable that an asset has been impaired or a liability has been incurred and the amount of the loss can be reasonably estimated. In determining whether a loss should be accrued we evaluate, among other factors, the degree of probability of an unfavorable outcome and the ability to make a reasonable estimate of the amount of loss. Changes in these factors could materially impact our consolidated financial statements.
Income Taxes
The objectives of accounting for income taxes are to recognize the amount of taxes payable or refundable for the current year, and deferred tax liabilities and assets for the future tax consequences of events that have been recognized in an entity’s financial statements or tax returns. We recognize the tax benefit from an uncertain tax position only if it is more likely than not that the tax position will be sustained on examination by the taxing authorities, based on the technical merits of the position. The tax benefits recognized in the financial statements from such a position are measured based on the largest benefit that has a greater than 50% likelihood of being realized upon ultimate settlement. Accounting literature also provides guidance on derecognition of income tax assets and liabilities, classification of deferred income tax assets and liabilities, accounting for interest and penalties associated with tax positions, and income tax disclosures. Judgment is required in assessing the future tax consequences of events that have been recognized in our consolidated financial statements or tax returns. Variations in the actual outcome of these future tax consequences could materially impact our consolidated financial statements.
Inventories
Inventories are stated at average cost, subject to the lower of cost or net realizable value. Cost includes materials, labor, and manufacturing overhead related to the purchase and production of inventories. Net realizable value is the estimated selling price less estimated costs of completion, disposal, and transportation. We regularly review inventory quantities on hand, future purchase commitments with our suppliers, and the estimated utility of our inventory. These reviews include analysis of demand forecasts, product life cycle status, product development plans, current sales levels, pricing strategy, and component cost trends. If our review indicates a reduction in utility below carrying value, we reduce our inventory to a new cost basis through a charge to cost of revenue.
STATEMENT OF MANAGEMENT’S RESPONSIBILITY FOR FINANCIAL STATEMENTS
Management is responsible for the preparation of the consolidated financial statements and related information that are presented in this report. The consolidated financial statements, which include amounts based on management’s estimates and judgments, have been prepared in conformity with accounting principles generally accepted in the United States of America.
The Company designs and maintains accounting and internal control systems to provide reasonable assurance at reasonable cost that assets are safeguarded against loss from unauthorized use or disposition, and that the financial records are reliable for preparing consolidated financial statements and maintaining accountability for assets. These systems are augmented by written policies, an organizational structure providing division of responsibilities, careful selection and training of qualified personnel, and a program of internal audits.
The Company engaged Deloitte & Touche LLP, an independent registered public accounting firm, to audit and render an opinion on the consolidated financial statements and internal control over financial reporting in accordance with the standards of the Public Company Accounting Oversight Board (United States).
The Board of Directors, through its Audit Committee, consisting solely of independent directors of the Company, meets periodically with management, internal auditors, and our independent registered public accounting firm to ensure that each is meeting its responsibilities and to discuss matters concerning internal controls and financial reporting. Deloitte & Touche LLP and the internal auditors each have full and free access to the Audit Committee.
Satya Nadella
Chief Executive Officer
Amy E. Hood
Executive Vice President and Chief Financial Officer
Alice L. Jolla
Corporate Vice President and Chief Accounting Officer
QUANTITATIVE AND QUALITATIVE DISCLOSURES ABOUT MARKET RISK
RISKS
We are exposed to economic risk from foreign exchange rates, interest rates, credit risk, and equity prices. We use derivatives instruments to manage these risks, however, they may still impact our consolidated financial statements.
Foreign Currencies
Certain forecasted transactions, assets, and liabilities are exposed to foreign currency risk. We monitor our foreign currency exposures daily to maximize the economic effectiveness of our foreign currency positions, including hedges. Principal currency exposures include the Euro, Japanese yen, British pound, Canadian dollar, and Australian dollar.
Interest Rate
Securities held in our fixed-income portfolio are subject to different interest rate risks based on their maturities. We manage the average maturity of the fixed-income portfolio to achieve economic returns that correlate to certain global fixed-income indices.
Credit
Our fixed-income portfolio is diversified and consists primarily of investment-grade securities. We manage credit exposures relative to broad-based indices to facilitate portfolio diversification.
Equity
Securities held in our equity investments portfolio are subject to price risk.
SENSITIVITY ANALYSIS
The following table sets forth the potential loss in future earnings or fair values, including associated derivatives, resulting from hypothetical changes in relevant market rates or prices:
| (In millions) |
| Risk Categories |
|
Hypothetical Change |
June 30,
2023 |
|
|
Impact |
| Foreign currency – Revenue |
|
10% decrease in foreign exchange rates |
$ (8,122) |
|
|
Earnings |
| Foreign currency – Investments |
|
10% decrease in foreign exchange rates |
(29) |
|
|
Fair Value |
| Interest rate |
|
100 basis point increase in U.S. treasury interest rates |
(1,832) |
|
|
Fair Value |
| Credit |
|
100 basis point increase in credit spreads |
(354) |
|
|
Fair Value |
| Equity |
|
10% decrease in equity market prices |
(705) |
|
|
Earnings |
FINANCIAL STATEMENTS AND SUPPLEMENTARY DATA
INCOME STATEMENTS
| (In millions, except per share amounts) |
| Year Ended June 30, |
2023 |
|
2022 |
|
2021 |
| Revenue: |
|
|
|
|
|
| Product |
$ 64,699 |
|
$ 72,732 |
|
$ 71,074 |
| Service and other |
147,216 |
|
125,538 |
|
97,014 |
| Total revenue |
211,915 |
|
198,270 |
|
168,088 |
| Cost of revenue: |
|
|
|
|
|
| Product |
17,804 |
|
19,064 |
|
18,219 |
| Service and other |
48,059 |
|
43,586 |
|
34,013 |
| Total cost of revenue |
65,863 |
|
62,650 |
|
52,232 |
| Gross margin |
146,052 |
|
135,620 |
|
115,856 |
| Research and development |
27,195 |
|
24,512 |
|
20,716 |
| Sales and marketing |
22,759 |
|
21,825 |
|
20,117 |
| General and administrative |
7,575 |
|
5,900 |
|
5,107 |
| Operating income |
88,523 |
|
83,383 |
|
69,916 |
| Other income, net |
788 |
|
333 |
|
1,186 |
| Income before income taxes |
89,311 |
|
83,716 |
|
71,102 |
| Provision for income taxes |
16,950 |
|
10,978 |
|
9,831 |
| Net income |
$ 72,361 |
|
$ 72,738 |
|
$ 61,271 |
| Earnings per share: |
|
|
|
|
|
| Basic |
$ 9.72 |
|
$ 9.70 |
|
$ 8.12 |
| Diluted |
$ 9.68 |
|
$ 9.65 |
|
$ 8.05 |
| Weighted average shares outstanding: |
|
|
|
|
|
| Basic |
7,446 |
|
7,496 |
|
7,547 |
| Diluted |
7,472 |
|
7,540 |
|
7,608 |
Refer to accompanying notes.
COMPREHENSIVE INCOME STATEMENTS
| (In millions) |
| Year Ended June 30, |
2023 |
|
2022 |
|
2021 |
| Net income |
$ 72,361 |
|
$ 72,738 |
|
$ 61,271 |
| Other comprehensive income (loss), net of tax: |
|
|
|
|
|
| Net change related to derivatives |
(14) |
|
6 |
|
19 |
| Net change related to investments |
(1,444) |
|
(5,360) |
|
(2,266) |
| Translation adjustments and other |
(207) |
|
(1,146) |
|
873 |
| Other comprehensive loss |
(1,665) |
|
(6,500) |
|
(1,374) |
| Comprehensive income |
$ 70,696 |
|
$ 66,238 |
|
$ 59,897 |
Refer to accompanying notes.
BALANCE SHEETS
| (In millions) |
| June 30, |
2023 |
|
2022 |
| Assets |
|
|
|
| Current assets: |
|
|
|
| Cash and cash equivalents |
$ 34,704 |
|
$ 13,931 |
| Short-term investments |
76,558 |
|
90,826 |
| Total cash, cash equivalents, and short-term investments |
111,262 |
|
104,757 |
| Accounts receivable, net of allowance for doubtful accounts of $650 and $633 |
48,688 |
|
44,261 |
| Inventories |
2,500 |
|
3,742 |
| Other current assets |
21,807 |
|
16,924 |
| Total current assets |
184,257 |
|
169,684 |
| Property and equipment, net of accumulated depreciation of $68,251 and $59,660 |
95,641 |
|
74,398 |
| Operating lease right-of-use assets |
14,346 |
|
13,148 |
| Equity investments |
9,879 |
|
6,891 |
| Goodwill |
67,886 |
|
67,524 |
| Intangible assets, net |
9,366 |
|
11,298 |
| Other long-term assets |
30,601 |
|
21,897 |
| Total assets |
$ 411,976 |
|
$ 364,840 |
| Liabilities and stockholders’ equity |
|
|
|
| Current liabilities: |
|
|
|
| Accounts payable |
$ 18,095 |
|
$ 19,000 |
| Current portion of long-term debt |
5,247 |
|
2,749 |
| Accrued compensation |
11,009 |
|
10,661 |
| Short-term income taxes |
4,152 |
|
4,067 |
| Short-term unearned revenue |
50,901 |
|
45,538 |
| Other current liabilities |
14,745 |
|
13,067 |
| Total current liabilities |
104,149 |
|
95,082 |
| Long-term debt |
41,990 |
|
47,032 |
| Long-term income taxes |
25,560 |
|
26,069 |
| Long-term unearned revenue |
2,912 |
|
2,870 |
| Deferred income taxes |
433 |
|
230 |
| Operating lease liabilities |
12,728 |
|
11,489 |
| Other long-term liabilities |
17,981 |
|
15,526 |
| Total liabilities |
205,753 |
|
198,298 |
| Commitments and contingencies |
|
|
|
| Stockholders’ equity: |
|
|
|
| Common stock and paid-in capital – shares authorized 24,000; outstanding 7,432 and 7,464 |
93,718 |
|
86,939 |
| Retained earnings |
118,848 |
|
84,281 |
| Accumulated other comprehensive loss |
(6,343) |
|
(4,678) |
| Total stockholders’ equity |
206,223 |
|
166,542 |
| Total liabilities and stockholders’ equity |
$ 411,976 |
|
$ 364,840 |
Refer to accompanying notes.
CASH FLOWS STATEMENTS
| (In millions) |
| Year Ended June 30, |
2023 |
|
2022 |
|
2021 |
| Operations |
|
|
|
|
|
| Net income |
$ 72,361 |
|
$ 72,738 |
|
$ 61,271 |
| Adjustments to reconcile net income to net cash from operations: |
|
|
|
|
|
| Depreciation, amortization, and other |
13,861 |
|
14,460 |
|
11,686 |
| Stock-based compensation expense |
9,611 |
|
7,502 |
|
6,118 |
| Net recognized losses (gains) on investments and derivatives |
196 |
|
(409) |
|
(1,249) |
| Deferred income taxes |
(6,059) |
|
(5,702) |
|
(150) |
| Changes in operating assets and liabilities: |
|
|
|
|
|
| Accounts receivable |
(4,087) |
|
(6,834) |
|
(6,481) |
| Inventories |
1,242 |
|
(1,123) |
|
(737) |
| Other current assets |
(1,991) |
|
(709) |
|
(932) |
| Other long-term assets |
(2,833) |
|
(2,805) |
|
(3,459) |
| Accounts payable |
(2,721) |
|
2,943 |
|
2,798 |
| Unearned revenue |
5,535 |
|
5,109 |
|
4,633 |
| Income taxes |
(358) |
|
696 |
|
(2,309) |
| Other current liabilities |
2,272 |
|
2,344 |
|
4,149 |
| Other long-term liabilities |
553 |
|
825 |
|
1,402 |
| Net cash from operations |
87,582 |
|
89,035 |
|
76,740 |
| Financing |
|
|
|
|
|
| Cash premium on debt exchange |
0 |
|
0 |
|
(1,754) |
| Repayments of debt |
(2,750) |
|
(9,023) |
|
(3,750) |
| Common stock issued |
1,866 |
|
1,841 |
|
1,693 |
| Common stock repurchased |
(22,245) |
|
(32,696) |
|
(27,385) |
| Common stock cash dividends paid |
(19,800) |
|
(18,135) |
|
(16,521) |
| Other, net |
(1,006) |
|
(863) |
|
(769) |
| Net cash used in financing |
(43,935) |
|
(58,876) |
|
(48,486) |
| Investing |
|
|
|
|
|
| Additions to property and equipment |
(28,107) |
|
(23,886) |
|
(20,622) |
| Acquisition of companies, net of cash acquired, and purchases of intangible and other assets |
(1,670) |
|
(22,038) |
|
(8,909) |
| Purchases of investments |
(37,651) |
|
(26,456) |
|
(62,924) |
| Maturities of investments |
33,510 |
|
16,451 |
|
51,792 |
| Sales of investments |
14,354 |
|
28,443 |
|
14,008 |
| Other, net |
(3,116) |
|
(2,825) |
|
(922) |
| Net cash used in investing |
(22,680) |
|
(30,311) |
|
(27,577) |
| Effect of foreign exchange rates on cash and cash equivalents |
(194) |
|
(141) |
|
(29) |
| Net change in cash and cash equivalents |
20,773 |
|
(293) |
|
648 |
| Cash and cash equivalents, beginning of period |
13,931 |
|
14,224 |
|
13,576 |
| Cash and cash equivalents, end of period |
$ 34,704 |
|
$ 13,931 |
|
$ 14,224 |
Refer to accompanying notes.
STOCKHOLDERS’ EQUITY STATEMENTS
| (In millions, except per share amounts) |
| Year Ended June 30, |
2023 |
|
2022 |
|
2021 |
| Common stock and paid-in capital |
|
|
|
|
|
| Balance, beginning of period |
$ 86,939 |
|
$ 83,111 |
|
$ 80,552 |
| Common stock issued |
1,866 |
|
1,841 |
|
1,963 |
| Common stock repurchased |
(4,696) |
|
(5,688) |
|
(5,539) |
| Stock-based compensation expense |
9,611 |
|
7,502 |
|
6,118 |
| Other, net |
(2) |
|
173 |
|
17 |
| Balance, end of period |
93,718 |
|
86,939 |
|
83,111 |
| Retained earnings |
|
|
|
|
|
| Balance, beginning of period |
84,281 |
|
57,055 |
|
34,566 |
| Net income |
72,361 |
|
72,738 |
|
61,271 |
| Common stock cash dividends |
(20,226) |
|
(18,552) |
|
(16,871) |
| Common stock repurchased |
(17,568) |
|
(26,960) |
|
(21,879) |
| Cumulative effect of accounting changes |
0 |
|
0 |
|
(32) |
| Balance, end of period |
118,848 |
|
84,281 |
|
57,055 |
| Accumulated other comprehensive income (loss) |
|
|
|
|
|
| Balance, beginning of period |
(4,678) |
|
1,822 |
|
3,186 |
| Other comprehensive loss |
(1,665) |
|
(6,500) |
|
(1,374) |
| Cumulative effect of accounting changes |
0 |
|
0 |
|
10 |
| Balance, end of period |
(6,343) |
|
(4,678) |
|
1,822 |
| Total stockholders’ equity |
$ 206,223 |
|
$ 166,542 |
|
$ 141,988 |
| Cash dividends declared per common share |
$ 2.72 |
|
$ 2.48 |
|
$ 2.24 |
Refer to accompanying notes.
NOTES
NOTES TO FINANCIAL STATEMENTS
NOTE 1 — ACCOUNTING POLICIES
Accounting Principles
Our consolidated financial statements and accompanying notes are prepared in accordance with accounting principles generally accepted in the United States of America (“GAAP”).
We have recast certain prior period amounts to conform to the current period presentation. The recast of these prior period amounts had no impact on our consolidated balance sheets, consolidated income statements, or consolidated cash flows statements.
Principles of Consolidation
The consolidated financial statements include the accounts of Microsoft Corporation and its subsidiaries. Intercompany transactions and balances have been eliminated.
Estimates and Assumptions
Preparing financial statements requires management to make estimates and assumptions that affect the reported amounts of assets, liabilities, revenue, and expenses. Examples of estimates and assumptions include: for revenue recognition, determining the nature and timing of satisfaction of performance obligations, and determining the standalone selling price (“SSP”) of performance obligations, variable consideration, and other obligations such as product returns and refunds; loss contingencies; product warranties; the fair value of and/or potential impairment of goodwill and intangible assets for our reporting units; product life cycles; useful lives of our tangible and intangible assets; allowances for doubtful accounts; the market value of, and demand for, our inventory; stock-based compensation forfeiture rates; when technological feasibility is achieved for our products; the potential outcome of uncertain tax positions that have been recognized in our consolidated financial statements or tax returns; and determining the timing and amount of impairments for investments. Actual results and outcomes may differ from management’s estimates and assumptions due to risks and uncertainties.
In July 2022, we completed an assessment of the useful lives of our server and network equipment. Due to investments in software that increased efficiencies in how we operate our server and network equipment, as well as advances in technology, we determined we should increase the estimated useful lives of both server and network equipment from four years to six years. This change in accounting estimate was effective beginning fiscal year 2023. Based on the carrying amount of server and network equipment included in property and equipment, net as of June 30, 2022, the effect of this change in estimate for fiscal year 2023 was an increase in operating income of $3.7 billion and net income of $3.0 billion, or $0.40 per both basic and diluted share.
Foreign Currencies
Assets and liabilities recorded in foreign currencies are translated at the exchange rate on the balance sheet date. Revenue and expenses are translated at average rates of exchange prevailing during the year. Translation adjustments resulting from this process are recorded to other comprehensive income.
Revenue
Product Revenue and Service and Other Revenue
Product revenue includes sales from operating systems, cross-device productivity and collaboration applications, server applications, business solution applications, desktop and server management tools, software development tools, video games, and hardware such as PCs, tablets, gaming and entertainment consoles, other intelligent devices, and related accessories.
Service and other revenue includes sales from cloud-based solutions that provide customers with software, services, platforms, and content such as Office 365, Azure, Dynamics 365, and Xbox; solution support; and consulting services. Service and other revenue also includes sales from online advertising and LinkedIn.
Revenue Recognition
Revenue is recognized upon transfer of control of promised products or services to customers in an amount that reflects the consideration we expect to receive in exchange for those products or services. We enter into contracts that can include various combinations of products and services, which are generally capable of being distinct and accounted for as separate performance obligations. Revenue is recognized net of allowances for returns and any taxes collected from customers, which are subsequently remitted to governmental authorities.
Nature of Products and Services
Licenses for on-premises software provide the customer with a right to use the software as it exists when made available to the customer. Customers may purchase perpetual licenses or subscribe to licenses, which provide customers with the same functionality and differ mainly in the duration over which the customer benefits from the software. Revenue from distinct on-premises licenses is recognized upfront at the point in time when the software is made available to the customer. In cases where we allocate revenue to software updates, primarily because the updates are provided at no additional charge, revenue is recognized as the updates are provided, which is generally ratably over the estimated life of the related device or license.
Certain volume licensing programs, including Enterprise Agreements, include on-premises licenses combined with Software Assurance (“SA”). SA conveys rights to new software and upgrades released over the contract period and provides support, tools, and training to help customers deploy and use products more efficiently. On-premises licenses are considered distinct performance obligations when sold with SA. Revenue allocated to SA is generally recognized ratably over the contract period as customers simultaneously consume and receive benefits, given that SA comprises distinct performance obligations that are satisfied over time.
Cloud services, which allow customers to use hosted software over the contract period without taking possession of the software, are provided on either a subscription or consumption basis. Revenue related to cloud services provided on a subscription basis is recognized ratably over the contract period. Revenue related to cloud services provided on a consumption basis, such as the amount of storage used in a period, is recognized based on the customer utilization of such resources. When cloud services require a significant level of integration and interdependency with software and the individual components are not considered distinct, all revenue is recognized over the period in which the cloud services are provided.
Revenue from search advertising is recognized when the advertisement appears in the search results or when the action necessary to earn the revenue has been completed. Revenue from consulting services is recognized as services are provided.
Our hardware is generally highly dependent on, and interrelated with, the underlying operating system and cannot function without the operating system. In these cases, the hardware and software license are accounted for as a single performance obligation and revenue is recognized at the point in time when ownership is transferred to resellers or directly to end customers through retail stores and online marketplaces.
Refer to Note 19 – Segment Information and Geographic Data for further information, including revenue by significant product and service offering.
Significant Judgments
Our contracts with customers often include promises to transfer multiple products and services to a customer. Determining whether products and services are considered distinct performance obligations that should be accounted for separately versus together may require significant judgment. When a cloud-based service includes both on-premises software licenses and cloud services, judgment is required to determine whether the software license is considered distinct and accounted for separately, or not distinct and accounted for together with the cloud service and recognized over time. Certain cloud services, primarily Office 365, depend on a significant level of integration, interdependency, and interrelation between the desktop applications and cloud services, and are accounted for together as one performance obligation. Revenue from Office 365 is recognized ratably over the period in which the cloud services are provided.
Judgment is required to determine the SSP for each distinct performance obligation. We use a single amount to estimate SSP for items that are not sold separately, including on-premises licenses sold with SA or software updates provided at no additional charge. We use a range of amounts to estimate SSP when we sell each of the products and services separately and need to determine whether there is a discount to be allocated based on the relative SSP of the various products and services.
In instances where SSP is not directly observable, such as when we do not sell the product or service separately, we determine the SSP using information that may include market conditions and other observable inputs. We typically have more than one SSP for individual products and services due to the stratification of those products and services by customers and circumstances. In these instances, we may use information such as the size of the customer and geographic region in determining the SSP.
Due to the various benefits from and the nature of our SA program, judgment is required to assess the pattern of delivery, including the exercise pattern of certain benefits across our portfolio of customers.
Our products are generally sold with a right of return, we may provide other credits or incentives, and in certain instances we estimate customer usage of our products and services, which are accounted for as variable consideration when determining the amount of revenue to recognize. Returns and credits are estimated at contract inception and updated at the end of each reporting period if additional information becomes available. Changes to our estimated variable consideration were not material for the periods presented.
Contract Balances and Other Receivables
Timing of revenue recognition may differ from the timing of invoicing to customers. We record a receivable when revenue is recognized prior to invoicing, or unearned revenue when revenue is recognized subsequent to invoicing. For multi-year agreements, we generally invoice customers annually at the beginning of each annual coverage period. We record a receivable related to revenue recognized for multi-year on-premises licenses as we have an unconditional right to invoice and receive payment in the future related to those licenses.
Unearned revenue comprises mainly unearned revenue related to volume licensing programs, which may include SA and cloud services. Unearned revenue is generally invoiced annually at the beginning of each contract period for multi-year agreements and recognized ratably over the coverage period. Unearned revenue also includes payments for consulting services to be performed in the future, LinkedIn subscriptions, Office 365 subscriptions, Xbox subscriptions, Windows post-delivery support, Dynamics business solutions, and other offerings for which we have been paid in advance and earn the revenue when we transfer control of the product or service.
Refer to Note 13 – Unearned Revenue for further information, including unearned revenue by segment and changes in unearned revenue during the period.
Payment terms and conditions vary by contract type, although terms generally include a requirement of payment within 30 to 60 days. In instances where the timing of revenue recognition differs from the timing of invoicing, we have determined our contracts generally do not include a significant financing component. The primary purpose of our invoicing terms is to provide customers with simplified and predictable ways of purchasing our products and services, not to receive financing from our customers or to provide customers with financing. Examples include invoicing at the beginning of a subscription term with revenue recognized ratably over the contract period, and multi-year on-premises licenses that are invoiced annually with revenue recognized upfront.
As of June 30, 2023 and 2022, long-term accounts receivable, net of allowance for doubtful accounts, was $4.5 billion and $3.8 billion, respectively, and is included in other long-term assets in our consolidated balance sheets.
The allowance for doubtful accounts reflects our best estimate of probable losses inherent in the accounts receivable balance. We determine the allowance based on known troubled accounts, historical experience, and other currently available evidence.
Activity in the allowance for doubtful accounts was as follows:
| (In millions) |
| Year Ended June 30, |
2023 |
|
2022 |
|
2021 |
| Balance, beginning of period |
$ 710 |
|
$ 798 |
|
$ 816 |
| Charged to costs and other |
258 |
|
157 |
|
234 |
| Write-offs |
(252) |
|
(245) |
|
(252) |
| Balance, end of period |
$ 716 |
|
$ 710 |
|
$ 798 |
Allowance for doubtful accounts included in our consolidated balance sheets: |
| (In millions) |
| June 30, |
2023 |
|
2022 |
|
2021 |
| Accounts receivable, net of allowance for doubtful accounts |
$ 650 |
|
$ 633 |
|
$ 751 |
| Other long-term assets |
66 |
|
77 |
|
47 |
| Total |
$ 716 |
|
$ 710 |
|
$ 798 |
As of June 30, 2023 and 2022, other receivables related to activities to facilitate the purchase of server components were $9.2 billion and $6.1 billion, respectively, and are included in other current assets in our consolidated balance sheets.
We record financing receivables when we offer certain of our customers the option to acquire our software products and services offerings through a financing program in a limited number of countries. As of June 30, 2023 and 2022, our financing receivables, net were $5.3 billion and $4.1 billion, respectively, for short-term and long-term financing receivables, which are included in other current assets and other long-term assets in our consolidated balance sheets. We record an allowance to cover expected losses based on troubled accounts, historical experience, and other currently available evidence.
Assets Recognized from Costs to Obtain a Contract with a Customer
We recognize an asset for the incremental costs of obtaining a contract with a customer if we expect the benefit of those costs to be longer than one year. We have determined that certain sales incentive programs meet the requirements to be capitalized. Total capitalized costs to obtain a contract were immaterial during the periods presented and are included in other current and long-term assets in our consolidated balance sheets.
We apply a practical expedient to expense costs as incurred for costs to obtain a contract with a customer when the amortization period would have been one year or less. These costs include our internal sales organization compensation program and certain partner sales incentive programs as we have determined annual compensation is commensurate with annual sales activities.
Cost of Revenue
Cost of revenue includes: manufacturing and distribution costs for products sold and programs licensed; operating costs related to product support service centers and product distribution centers; costs incurred to include software on PCs sold by original equipment manufacturers (“OEM”), to drive traffic to our websites, and to acquire online advertising space; costs incurred to support and maintain cloud-based and other online products and services, including datacenter costs and royalties; warranty costs; inventory valuation adjustments; costs associated with the delivery of consulting services; and the amortization of capitalized software development costs. Capitalized software development costs are amortized over the estimated lives of the products.
Product Warranty
We provide for the estimated costs of fulfilling our obligations under hardware and software warranties at the time the related revenue is recognized. For hardware warranties, we estimate the costs based on historical and projected product failure rates, historical and projected repair costs, and knowledge of specific product failures (if any). The specific hardware warranty terms and conditions vary depending upon the product sold and the country in which we do business, but generally include parts and labor over a period generally ranging from 90 days to three years. For software warranties, we estimate the costs to provide bug fixes, such as security patches, over the estimated life of the software. We regularly reevaluate our estimates to assess the adequacy of the recorded warranty liabilities and adjust the amounts as necessary.
Research and Development
Research and development expenses include payroll, employee benefits, stock-based compensation expense, and other headcount-related expenses associated with product development. Research and development expenses also include third-party development and programming costs and the amortization of purchased software code and services content. Such costs related to software development are included in research and development expense until the point that technological feasibility is reached, which for our software products, is generally shortly before the products are released to production. Once technological feasibility is reached, such costs are capitalized and amortized to cost of revenue over the estimated lives of the products.
Sales and Marketing
Sales and marketing expenses include payroll, employee benefits, stock-based compensation expense, and other headcount-related expenses associated with sales and marketing personnel, and the costs of advertising, promotions, trade shows, seminars, and other programs. Advertising costs are expensed as incurred. Advertising expense was $904 million, $1.5 billion, and $1.5 billion in fiscal years 2023, 2022, and 2021, respectively.
Stock-Based Compensation
Compensation cost for stock awards, which include restricted stock units (“RSUs”) and performance stock units (“PSUs”), is measured at the fair value on the grant date and recognized as expense, net of estimated forfeitures, over the related service or performance period. The fair value of stock awards is based on the quoted price of our common stock on the grant date less the present value of expected dividends not received during the vesting period. We measure the fair value of PSUs using a Monte Carlo valuation model. Compensation cost for RSUs is recognized using the straight-line method and for PSUs is recognized using the accelerated method.
Compensation expense for the employee stock purchase plan (“ESPP”) is measured as the discount the employee is entitled to upon purchase and is recognized in the period of purchase.
Employee Severance
On January 18, 2023, we announced a decision to reduce our overall workforce by approximately 10,000 jobs through the third quarter of fiscal year 2023. During the three months ended December 31, 2022, we recorded $800 million of employee severance expenses related to these job eliminations as part of an ongoing employee benefit plan. These employee severance expenses were incurred as part of a corporate program, and were included in general and administrative expenses in our consolidated income statements and allocated to our segments based on relative gross margin. Refer to Note 19 – Segment Information and Geographic Data for further information.
Income Taxes
Income tax expense includes U.S. and international income taxes, and interest and penalties on uncertain tax positions. Certain income and expenses are not reported in tax returns and financial statements in the same year. The tax effect of such temporary differences is reported as deferred income taxes. Deferred tax assets are reported net of a valuation allowance when it is more likely than not that a tax benefit will not be realized. All deferred income taxes are classified as long-term in our consolidated balance sheets.
Financial Instruments
Investments
We consider all highly liquid interest-earning investments with a maturity of three months or less at the date of purchase to be cash equivalents. The fair values of these investments approximate their carrying values. In general, investments with original maturities of greater than three months and remaining maturities of less than one year are classified as short-term investments. Investments with maturities beyond one year may be classified as short-term based on their highly liquid nature and because such marketable securities represent the investment of cash that is available for current operations.
Debt investments are classified as available-for-sale and realized gains and losses are recorded using the specific identification method. Changes in fair value, excluding credit losses and impairments, are recorded in other comprehensive income. Fair value is calculated based on publicly available market information or other estimates determined by management. If the cost of an investment exceeds its fair value, we evaluate, among other factors, general market conditions, credit quality of debt instrument issuers, and the extent to which the fair value is less than cost. To determine credit losses, we employ a systematic methodology that considers available quantitative and qualitative evidence. In addition, we consider specific adverse conditions related to the financial health of, and business outlook for, the investee. If we have plans to sell the security or it is more likely than not that we will be required to sell the security before recovery, then a decline in fair value below cost is recorded as an impairment charge in other income (expense), net and a new cost basis in the investment is established. If market, industry, and/or investee conditions deteriorate, we may incur future impairments.
Equity investments with readily determinable fair values are measured at fair value. Equity investments without readily determinable fair values are measured using the equity method or measured at cost with adjustments for observable changes in price or impairments (referred to as the measurement alternative). We perform a qualitative assessment on a periodic basis and recognize an impairment if there are sufficient indicators that the fair value of the investment is less than carrying value. Changes in value are recorded in other income (expense), net.
Derivatives
Derivative instruments are recognized as either assets or liabilities and measured at fair value. The accounting for changes in the fair value of a derivative depends on the intended use of the derivative and the resulting designation.
For derivative instruments designated as fair value hedges, gains and losses are recognized in other income (expense), net with offsetting gains and losses on the hedged items. Gains and losses representing hedge components excluded from the assessment of effectiveness are recognized in other income (expense), net.
For derivative instruments designated as cash flow hedges, gains and losses are initially reported as a component of other comprehensive income and subsequently recognized in other income (expense), net with the corresponding hedged item. Gains and losses representing hedge components excluded from the assessment of effectiveness are recognized in other income (expense), net.
For derivative instruments that are not designated as hedges, gains and losses from changes in fair values are primarily recognized in other income (expense), net.
Fair Value Measurements
We account for certain assets and liabilities at fair value. The hierarchy below lists three levels of fair value based on the extent to which inputs used in measuring fair value are observable in the market. We categorize each of our fair value measurements in one of these three levels based on the lowest level input that is significant to the fair value measurement in its entirety. These levels are:
- Level 1 –inputs are based upon unadjusted quoted prices for identical instruments in active markets. Our Level 1 investments include U.S. government securities, common and preferred stock, and mutual funds. Our Level 1 derivative assets and liabilities include those actively traded on exchanges.
- Level 2 – inputs are based upon quoted prices for similar instruments in active markets, quoted prices for identical or similar instruments in markets that are not active, and model-based valuation techniques (e.g. the Black-Scholes model) for which all significant inputs are observable in the market or can be corroborated by observable market data for substantially the full term of the assets or liabilities. Where applicable, these models project future cash flows and discount the future amounts to a present value using market-based observable inputs including interest rate curves, credit spreads, foreign exchange rates, and forward and spot prices for currencies. Our Level 2 investments include commercial paper, certificates of deposit, U.S. agency securities, foreign government bonds, mortgage- and asset-backed securities, corporate notes and bonds, and municipal securities. Our Level 2 derivative assets and liabilities include certain cleared swap contracts and over-the-counter forward, option, and swap contracts.
- Level 3 – inputs are generally unobservable and typically reflect management’s estimates of assumptions that market participants would use in pricing the asset or liability. The fair values are therefore determined using model-based techniques, including option pricing models and discounted cash flow models. Our Level 3 assets and liabilities include investments in corporate notes and bonds, municipal securities, and goodwill and intangible assets, when they are recorded at fair value due to an impairment charge. Unobservable inputs used in the models are significant to the fair values of the assets and liabilities.
We measure equity investments without readily determinable fair values on a nonrecurring basis. The fair values of these investments are determined based on valuation techniques using the best information available, and may include quoted market prices, market comparables, and discounted cash flow projections.
Our other current financial assets and current financial liabilities have fair values that approximate their carrying values.
Inventories
Inventories are stated at average cost, subject to the lower of cost or net realizable value. Cost includes materials, labor, and manufacturing overhead related to the purchase and production of inventories. Net realizable value is the estimated selling price less estimated costs of completion, disposal, and transportation. We regularly review inventory quantities on hand, future purchase commitments with our suppliers, and the estimated utility of our inventory. If our review indicates a reduction in utility below carrying value, we reduce our inventory to a new cost basis through a charge to cost of revenue.
Property and Equipment
Property and equipment is stated at cost less accumulated depreciation, and depreciated using the straight-line method over the shorter of the estimated useful life of the asset or the lease term. The estimated useful lives of our property and equipment are generally as follows: computer software developed or acquired for internal use, three years; computer equipment, two to six years; buildings and improvements, five to 15 years; leasehold improvements, three to 20 years; and furniture and equipment, one to 10 years. Land is not depreciated.
Leases
We determine if an arrangement is a lease at inception. Operating leases are included in operating lease right-of-use (“ROU”) assets, other current liabilities, and operating lease liabilities in our consolidated balance sheets. Finance leases are included in property and equipment, other current liabilities, and other long-term liabilities in our consolidated balance sheets.
ROU assets represent our right to use an underlying asset for the lease term and lease liabilities represent our obligation to make lease payments arising from the lease. Operating lease ROU assets and liabilities are recognized at commencement date based on the present value of lease payments over the lease term. As most of our leases do not provide an implicit rate, we generally use our incremental borrowing rate based on the estimated rate of interest for collateralized borrowing over a similar term of the lease payments at commencement date. The operating lease ROU asset also includes any lease payments made and excludes lease incentives. Our lease terms may include options to extend or terminate the lease when it is reasonably certain that we will exercise that option. Lease expense for lease payments is recognized on a straight-line basis over the lease term.
We have lease agreements with lease and non-lease components, which are generally accounted for separately. For certain equipment leases, such as vehicles, we account for the lease and non-lease components as a single lease component. Additionally, for certain equipment leases, we apply a portfolio approach to effectively account for the operating lease ROU assets and liabilities.
Goodwill
Goodwill is tested for impairment at the reporting unit level (operating segment or one level below an operating segment) on an annual basis (May 1) and between annual tests if an event occurs or circumstances change that would more likely than not reduce the fair value of a reporting unit below its carrying value.
Intangible Assets
Our intangible assets are subject to amortization and are amortized using the straight-line method over their estimated period of benefit, ranging from one to 20 years. We evaluate the recoverability of intangible assets periodically by taking into account events or circumstances that may warrant revised estimates of useful lives or that indicate the asset may be impaired.
NOTE 2 — EARNINGS PER SHARE
Basic earnings per share (“EPS”) is computed based on the weighted average number of shares of common stock outstanding during the period. Diluted EPS is computed based on the weighted average number of shares of common stock plus the effect of dilutive potential common shares outstanding during the period using the treasury stock method. Dilutive potential common shares include outstanding stock options and stock awards.
The components of basic and diluted EPS were as follows:
| (In millions, except earnings per share) |
|
|
|
|
|
| Year Ended June 30, |
2023 |
|
2022 |
|
2021 |
| Net income available for common shareholders (A) |
$ 72,361 |
|
$ 72,738 |
|
$ 61,271 |
| Weighted average outstanding shares of common stock (B) |
7,446 |
|
7,496 |
|
7,547 |
| Dilutive effect of stock-based awards |
26 |
|
44 |
|
61 |
| Common stock and common stock equivalents (C) |
7,472 |
|
7,540 |
|
7,608 |
| Earnings Per Share |
|
|
|
|
|
| Basic (A/B) |
$ 9.72 |
|
$ 9.70 |
|
$ 8.12 |
| Diluted (A/C) |
$ 9.68 |
|
$ 9.65 |
|
$ 8.05 |
Anti-dilutive stock-based awards excluded from the calculations of diluted EPS were immaterial during the periods presented.
NOTE 3 — OTHER INCOME (EXPENSE), NET
The components of other income (expense), net were as follows:
| (In millions) |
| Year Ended June 30, |
2023 |
|
2022 |
|
2021 |
| Interest and dividends income |
$ 2,994 |
|
$ 2,094 |
|
$ 2,131 |
| Interest expense |
(1,968) |
|
(2,063) |
|
(2,346) |
| Net recognized gains on investments |
260 |
|
461 |
|
1,232 |
| Net gains (losses) on derivatives |
(456) |
|
(52) |
|
17 |
| Net gains (losses) on foreign currency remeasurements |
181 |
|
(75) |
|
54 |
| Other, net |
(223) |
|
(32) |
|
98 |
| Total |
$ 788 |
|
$ 333 |
|
$ 1,186 |
Net Recognized Gains (Losses) on Investments
Net recognized gains (losses) on debt investments were as follows:
| (In millions) |
| Year Ended June 30, |
2023 |
|
2022 |
|
2021 |
| Realized gains from sales of available-for-sale securities |
$ 36 |
|
$ 162 |
|
$ 105 |
| Realized losses from sales of available-for-sale securities |
(124) |
|
(138) |
|
(40) |
| Impairments and allowance for credit losses |
(10) |
|
(81) |
|
(2) |
| Total |
$ (98) |
|
$ (57) |
|
$ 63 |
Net recognized gains (losses) on equity investments were as follows:
| (In millions) |
| Year Ended June 30, |
2023 |
|
2022 |
|
2021 |
| Net realized gains on investments sold |
$ 75 |
|
$ 29 |
|
$ 123 |
| Net unrealized gains on investments still held |
303 |
|
509 |
|
1,057 |
| Impairments of investments |
(20) |
|
(20) |
|
(11) |
| Total |
$ 358 |
|
$ 518 |
|
$ 1,169 |
NOTE 4 — INVESTMENTS
Investment Components
The components of investments were as follows:
| (In millions) |
Fair Value
Level |
|
Adjusted
Cost Basis |
|
Unrealized
Gains |
|
Unrealized
Losses |
|
Recorded
Basis |
|
Cash
and Cash
Equivalents |
|
Short-term
Investments |
|
Equity
Investments |
| June 30, 2023 |
| Changes in Fair Value Recorded in Other Comprehensive Income |
|
| Commercial paper |
Level 2 |
|
$ 16,589 |
|
$ 0 |
|
$ 0 |
|
$ 16,589 |
|
$ 12,231 |
|
$ 4,358 |
|
$ 0 |
| Certificates of deposit |
Level 2 |
|
2,701 |
|
0 |
|
0 |
|
2,701 |
|
2,657 |
|
44 |
|
0 |
| U.S. government securities |
Level 1 |
|
65,237 |
|
2 |
|
(3,870) |
|
61,369 |
|
2,991 |
|
58,378 |
|
0 |
| U.S. agency securities |
Level 2 |
|
2,703 |
|
0 |
|
0 |
|
2,703 |
|
894 |
|
1,809 |
|
0 |
| Foreign government bonds |
Level 2 |
|
498 |
|
1 |
|
(24) |
|
475 |
|
0 |
|
475 |
|
0 |
| Mortgage- and asset-backed securities |
Level 2 |
|
824 |
|
1 |
|
(39) |
|
786 |
|
0 |
|
786 |
|
0 |
| Corporate notes and bonds |
Level 2 |
|
10,809 |
|
8 |
|
(583) |
|
10,234 |
|
0 |
|
10,234 |
|
0 |
| Corporate notes and bonds |
Level 3 |
|
120 |
|
0 |
|
0 |
|
120 |
|
0 |
|
120 |
|
0 |
| Municipal securities |
Level 2 |
|
285 |
|
1 |
|
(18) |
|
268 |
|
7 |
|
261 |
|
0 |
| Municipal securities |
Level 3 |
|
103 |
|
0 |
|
(16) |
|
87 |
|
0 |
|
87 |
|
0 |
| Total debt investments |
|
|
$ 99,869 |
|
$ 13 |
|
$ (4,550) |
|
$ 95,332 |
|
$ 18,780 |
|
$ 76,552 |
|
$ 0 |
| Changes in Fair Value Recorded in Net Income |
|
| Equity investments |
Level 1 |
|
|
|
|
|
|
|
$ 10,138 |
|
$ 7,446 |
|
$ 0 |
|
$ 2,692 |
| Equity investments |
Other |
|
|
|
|
|
|
|
7,187 |
|
0 |
|
0 |
|
7,187 |
| Total equity investments |
|
|
|
|
|
|
|
|
$ 17,325 |
|
$ 7,446 |
|
$ 0 |
|
$ 9,879 |
| Cash |
|
|
|
|
|
|
|
|
$ 8,478 |
|
$ 8,478 |
|
$ 0 |
|
$ 0 |
| Derivatives, net (a) |
|
|
|
|
|
|
|
|
6 |
|
0 |
|
6 |
|
0 |
| Total |
|
|
|
|
|
|
|
|
$ 121,141 |
|
$ 34,704 |
|
$ 76,558 |
|
$ 9,879 |
| (In millions) |
Fair Value
Level |
|
Adjusted
Cost Basis |
|
Unrealized
Gains |
|
Unrealized
Losses |
|
Recorded
Basis |
|
Cash
and Cash
Equivalents |
|
Short-term
Investments |
|
Equity
Investments |
| June 30, 2022 |
| Changes in Fair Value Recorded in Other Comprehensive Income |
|
| Commercial paper |
Level 2 |
|
$ 2,500 |
|
$ 0 |
|
$ 0 |
|
$ 2,500 |
|
$ 2,498 |
|
$ 2 |
|
$ 0 |
| Certificates of deposit |
Level 2 |
|
2,071 |
|
0 |
|
0 |
|
2,071 |
|
2,032 |
|
39 |
|
0 |
| U.S. government securities |
Level 1 |
|
79,696 |
|
29 |
|
(2,178) |
|
77,547 |
|
9 |
|
77,538 |
|
0 |
| U.S. agency securities |
Level 2 |
|
419 |
|
0 |
|
(9) |
|
410 |
|
0 |
|
410 |
|
0 |
| Foreign government bonds |
Level 2 |
|
506 |
|
0 |
|
(24) |
|
482 |
|
0 |
|
482 |
|
0 |
| Mortgage- and asset-backed securities |
Level 2 |
|
727 |
|
1 |
|
(30) |
|
698 |
|
0 |
|
698 |
|
0 |
| Corporate notes and bonds |
Level 2 |
|
11,661 |
|
4 |
|
(554) |
|
11,111 |
|
0 |
|
11,111 |
|
0 |
| Corporate notes and bonds |
Level 3 |
|
67 |
|
0 |
|
0 |
|
67 |
|
0 |
|
67 |
|
0 |
| Municipal securities |
Level 2 |
|
368 |
|
19 |
|
(13) |
|
374 |
|
0 |
|
374 |
|
0 |
| Municipal securities |
Level 3 |
|
103 |
|
0 |
|
(6) |
|
97 |
|
0 |
|
97 |
|
0 |
| Total debt investments |
|
|
$ 98,118 |
|
$ 53 |
|
$ (2,814) |
|
$ 95,357 |
|
$ 4,539 |
|
$ 90,818 |
|
$ 0 |
| Changes in Fair Value Recorded in Net Income |
|
| Equity investments |
Level 1 |
|
|
|
|
|
|
|
$ 1,590 |
|
$ 1,134 |
|
$ 0 |
|
$ 456 |
| Equity investments |
Other |
|
|
|
|
|
|
|
6,435 |
|
0 |
|
0 |
|
6,435 |
| Total equity investments |
|
|
|
|
|
|
|
|
$ 8,025 |
|
$ 1,134 |
|
$ 0 |
|
$ 6,891 |
| Cash |
|
|
|
|
|
|
|
|
$ 8,258 |
|
$ 8,258 |
|
$ 0 |
|
$ 0 |
| Derivatives, net (a) |
|
|
|
|
|
|
|
|
8 |
|
0 |
|
8 |
|
0 |
| Total |
|
|
|
|
|
|
|
|
$ 111,648 |
|
$ 13,931 |
|
$ 90,826 |
|
$ 6,891 |
- Refer to Note 5 – Derivatives for further information on the fair value of our derivative instruments.
Equity investments presented as “Other” in the tables above include investments without readily determinable fair values measured using the equity method or measured at cost with adjustments for observable changes in price or impairments, and investments measured at fair value using net asset value as a practical expedient which are not categorized in the fair value hierarchy. As of June 30, 2023 and 2022, equity investments without readily determinable fair values measured at cost with adjustments for observable changes in price or impairments were $4.2 billion and $3.8 billion, respectively.
Unrealized Losses on Debt Investments
Debt investments with continuous unrealized losses for less than 12 months and 12 months or greater and their related fair values were as follows:
|
Less than 12 Months |
|
12 Months or Greater |
|
|
|
Total
Unrealized
Losses |
| (In millions) |
Fair Value |
|
Unrealized
Losses |
|
Fair Value |
|
Unrealized
Losses |
|
Total
Fair Value |
|
| June 30, 2023 |
| U.S. government and agency securities |
$ 7,950 |
|
$ (336) |
|
$ 45,273 |
|
$ (3,534) |
|
$ 53,223 |
|
$ (3,870) |
| Foreign government bonds |
77 |
|
(5) |
|
391 |
|
(19) |
|
468 |
|
(24) |
| Mortgage- and asset-backed securities |
257 |
|
(5) |
|
412 |
|
(34) |
|
669 |
|
(39) |
| Corporate notes and bonds |
2,326 |
|
(49) |
|
7,336 |
|
(534) |
|
9,662 |
|
(583) |
| Municipal securities |
111 |
|
(3) |
|
186 |
|
(31) |
|
297 |
|
(34) |
| Total |
$ 10,721 |
|
$ (398) |
|
$ 53,598 |
|
$ (4,152) |
|
$ 64,319 |
|
$ (4,550) |
|
Less than 12 Months |
|
12 Months or Greater |
|
|
|
Total
Unrealized
Losses |
| (In millions) |
Fair Value |
|
Unrealized
Losses |
|
Fair Value |
|
Unrealized
Losses |
|
Total
Fair Value |
|
| June 30, 2022 |
| U.S. government and agency securities |
$ 59,092 |
|
$ (1,835) |
|
$ 2,210 |
|
$ (352) |
|
$ 61,302 |
|
$ (2,187) |
| Foreign government bonds |
418 |
|
(18) |
|
27 |
|
(6) |
|
445 |
|
(24) |
| Mortgage- and asset-backed securities |
510 |
|
(26) |
|
41 |
|
(4) |
|
551 |
|
(30) |
| Corporate notes and bonds |
9,443 |
|
(477) |
|
786 |
|
(77) |
|
10,229 |
|
(554) |
| Municipal securities |
178 |
|
(12) |
|
74 |
|
(7) |
|
252 |
|
(19) |
| Total |
$ 69,641 |
|
$ (2,368) |
|
$ 3,138 |
|
$ (446) |
|
$ 72,779 |
|
$ (2,814) |
Unrealized losses from fixed-income securities are primarily attributable to changes in interest rates. Management does not believe any remaining unrealized losses represent impairments based on our evaluation of available evidence.
Debt Investment Maturities
| (In millions) |
Adjusted
Cost Basis |
|
Estimated
Fair Value |
| June 30, 2023 |
|
|
|
| Due in one year or less |
$ 38,182 |
|
$ 38,048 |
| Due after one year through five years |
47,127 |
|
44,490 |
| Due after five years through 10 years |
13,262 |
|
11,628 |
| Due after 10 years |
1,298 |
|
1,166 |
| Total |
$ 99,869 |
|
$ 95,332 |
NOTE 5 — DERIVATIVES
We use derivative instruments to manage risks related to foreign currencies, interest rates, equity prices, and credit; to enhance investment returns; and to facilitate portfolio diversification. Our objectives for holding derivatives include reducing, eliminating, and efficiently managing the economic impact of these exposures as effectively as possible. Our derivative programs include strategies that both qualify and do not qualify for hedge accounting treatment.
Foreign Currencies
Certain forecasted transactions, assets, and liabilities are exposed to foreign currency risk. We monitor our foreign currency exposures daily to maximize the economic effectiveness of our foreign currency hedge positions.
Foreign currency risks related to certain non-U.S. dollar-denominated investments are hedged using foreign exchange forward contracts that are designated as fair value hedging instruments. Foreign currency risks related to certain Euro-denominated debt are hedged using foreign exchange forward contracts that are designated as cash flow hedging instruments.
Certain options and forwards not designated as hedging instruments are also used to manage the variability in foreign exchange rates on certain balance sheet amounts and to manage other foreign currency exposures.
Interest Rate
Interest rate risks related to certain fixed-rate debt are hedged using interest rate swaps that are designated as fair value hedging instruments to effectively convert the fixed interest rates to floating interest rates.
Securities held in our fixed-income portfolio are subject to different interest rate risks based on their maturities. We manage the average maturity of our fixed-income portfolio to achieve economic returns that correlate to certain broad-based fixed-income indices using option, futures, and swap contracts. These contracts are not designated as hedging instruments and are included in “Other contracts” in the tables below.
Equity
Securities held in our equity investments portfolio are subject to market price risk. At times, we may hold options, futures, and swap contracts. These contracts are not designated as hedging instruments.
Credit
Our fixed-income portfolio is diversified and consists primarily of investment-grade securities. We use credit default swap contracts to manage credit exposures relative to broad-based indices and to facilitate portfolio diversification. These contracts are not designated as hedging instruments and are included in “Other contracts” in the tables below.
Credit-Risk-Related Contingent Features
Certain of our counterparty agreements for derivative instruments contain provisions that require our issued and outstanding long-term unsecured debt to maintain an investment grade credit rating and require us to maintain minimum liquidity of $1.0 billion. To the extent we fail to meet these requirements, we will be required to post collateral, similar to the standard convention related to over-the-counter derivatives. As of June 30, 2023, our long-term unsecured debt rating was AAA, and cash investments were in excess of $1.0 billion. As a result, no collateral was required to be posted.
The following table presents the notional amounts of our outstanding derivative instruments measured in U.S. dollar equivalents:
| (In millions) |
June 30,
2023 |
|
June 30,
2022 |
| Designated as Hedging Instruments |
|
|
|
| Foreign exchange contracts purchased |
$ 1,492 |
|
$ 635 |
| Interest rate contracts purchased |
1,078 |
|
1,139 |
| Not Designated as Hedging Instruments |
|
|
|
| Foreign exchange contracts purchased |
7,874 |
|
10,322 |
| Foreign exchange contracts sold |
25,159 |
|
21,606 |
| Equity contracts purchased |
3,867 |
|
1,131 |
| Equity contracts sold |
2,154 |
|
0 |
| Other contracts purchased |
1,224 |
|
1,642 |
| Other contracts sold |
581 |
|
544 |
Fair Values of Derivative Instruments
The following table presents our derivative instruments:
| (In millions) |
Derivative
Assets |
|
Derivative
Liabilities |
|
Derivative
Assets |
|
Derivative
Liabilities |
|
|
|
June 30,
2023 |
|
|
|
June 30,
2022 |
| Designated as Hedging Instruments |
| Foreign exchange contracts |
$ 34 |
|
$ (67) |
|
$ 0 |
|
$ (77) |
| Interest rate contracts |
16 |
|
0 |
|
3 |
|
0 |
| Not Designated as Hedging Instruments |
| Foreign exchange contracts |
249 |
|
(332) |
|
333 |
|
(362) |
| Equity contracts |
165 |
|
(400) |
|
5 |
|
(95) |
| Other contracts |
5 |
|
(6) |
|
15 |
|
(17) |
| Gross amounts of derivatives |
469 |
|
(805) |
|
356 |
|
(551) |
| Gross amounts of derivatives offset in the balance sheet |
(202) |
|
206 |
|
(130) |
|
133 |
| Cash collateral received |
0 |
|
(125) |
|
0 |
|
(75) |
| Net amounts of derivatives |
$ 267 |
|
$ (724) |
|
$ 226 |
|
$ (493) |
| Reported as |
| Short-term investments |
$ 6 |
|
$ 0 |
|
$ 8 |
|
$ 0 |
| Other current assets |
245 |
|
0 |
|
218 |
|
0 |
| Other long-term assets |
16 |
|
0 |
|
0 |
|
0 |
| Other current liabilities |
0 |
|
(341) |
|
0 |
|
(298) |
| Other long-term liabilities |
0 |
|
(383) |
|
0 |
|
(195) |
| Total |
$ 267 |
|
$ (724) |
|
$ 226 |
|
$ (493) |
Gross derivative assets and liabilities subject to legally enforceable master netting agreements for which we have elected to offset were $442 million and $804 million, respectively, as of June 30, 2023, and $343 million and $550 million, respectively, as of June 30, 2022.
The following table presents the fair value of our derivatives instruments on a gross basis:
| (In millions) |
Level 1 |
|
Level 2 |
|
Level 3 |
|
Total |
| June 30, 2023 |
| Derivative assets |
$ 0 |
|
$ 462 |
|
$ 7 |
|
$ 469 |
| Derivative liabilities |
0 |
|
(805) |
|
0 |
|
(805) |
| June 30, 2022 |
| Derivative assets |
1 |
|
349 |
|
6 |
|
356 |
| Derivative liabilities |
0 |
|
(551) |
|
0 |
|
(551) |
Gains (losses) on derivative instruments recognized in other income (expense), net were as follows:
| (In millions) |
| Year Ended June 30, |
|
2023 |
|
2022 |
|
2021 |
| Designated as Fair Value Hedging Instruments |
| Foreign exchange contracts |
| Derivatives |
|
$ 0 |
|
$ 49 |
|
$ 193 |
| Hedged items |
|
0 |
|
(50) |
|
(188) |
| Excluded from effectiveness assessment |
|
0 |
|
4 |
|
30 |
| Interest rate contracts |
| Derivatives |
|
(65) |
|
(92) |
|
(37) |
| Hedged items |
|
38 |
|
108 |
|
53 |
| Designated as Cash Flow Hedging Instruments |
| Foreign exchange contracts |
| Amount reclassified from accumulated other comprehensive income |
|
61 |
|
(79) |
|
17 |
| Not Designated as Hedging Instruments |
| Foreign exchange contracts |
|
(73) |
|
383 |
|
27 |
| Equity contracts |
|
(420) |
|
13 |
|
(6) |
| Other contracts |
|
(41) |
|
(85) |
|
15 |
Gains (losses), net of tax, on derivative instruments recognized in our consolidated comprehensive income statements were as follows:
| (In millions) |
| Year Ended June 30, |
2023 |
|
2022 |
|
2021 |
| Designated as Cash Flow Hedging Instruments |
| Foreign exchange contracts |
| Included in effectiveness assessment |
$ 34 |
|
$ (57) |
|
$ 34 |
NOTE 6 — INVENTORIES
The components of inventories were as follows:
| (In millions) |
| June 30, |
|
2023 |
|
2022 |
| Raw materials |
|
$ 709 |
|
$ 1,144 |
| Work in process |
|
23 |
|
82 |
| Finished goods |
|
1,768 |
|
2,516 |
| Total |
|
$ 2,500 |
|
$ 3,742 |
NOTE 7 — PROPERTY AND EQUIPMENT
The components of property and equipment were as follows:
| (In millions) |
| June 30, |
2023 |
|
2022 |
| Land |
$ 5,683 |
|
$ 4,734 |
| Buildings and improvements |
68,465 |
|
55,014 |
| Leasehold improvements |
8,537 |
|
7,819 |
| Computer equipment and software |
74,961 |
|
60,631 |
| Furniture and equipment |
6,246 |
|
5,860 |
| Total, at cost |
163,892 |
|
134,058 |
| Accumulated depreciation |
(68,251) |
|
(59,660) |
| Total, net |
$ 95,641 |
|
$ 74,398 |
During fiscal years 2023, 2022, and 2021, depreciation expense was $11.0 billion, $12.6 billion, and $9.3 billion, respectively. Depreciation expense declined in fiscal year 2023 due to the change in estimated useful lives of our server and network equipment.
As of June 30, 2023, we have committed $13.5 billion for the construction of new buildings, building improvements, and leasehold improvements, primarily related to datacenters.
NOTE 8 — BUSINESS COMBINATIONS
Nuance Communications, Inc.
On March 4, 2022, we completed our acquisition of Nuance Communications, Inc. (“Nuance”) for a total purchase price of $18.8 billion, consisting primarily of cash. Nuance is a cloud and artificial intelligence (“AI”) software provider with healthcare and enterprise AI experience, and the acquisition will build on our industry-specific cloud offerings. The financial results of Nuance have been included in our consolidated financial statements since the date of the acquisition. Nuance is reported as part of our Intelligent Cloud segment.
The allocation of the purchase price to goodwill was completed as of December 31, 2022. The major classes of assets and liabilities to which we have allocated the purchase price were as follows:
| (In millions) |
| Goodwill (a) |
|
$ 16,326 |
| Intangible assets |
|
4,365 |
| Other assets |
|
42 |
| Other liabilities (b) |
|
(1,972) |
| Total |
|
$ 18,761 |
- Goodwill was assigned to our Intelligent Cloud segment and was primarily attributed to increased synergies that are expected to be achieved from the integration of Nuance. None of the goodwill is expected to be deductible for income tax purposes.
- Includes $986 million of convertible senior notes issued by Nuance in 2015 and 2017, substantially all of which have been redeemed.
Following are the details of the purchase price allocated to the intangible assets acquired:
| (In millions, except average life) |
Amount |
|
Weighted
Average Life |
| Customer-related |
$ 2,610 |
|
9 years |
| Technology-based |
1,540 |
|
5 years |
| Marketing-related |
215 |
|
4 years |
| Total |
$ 4,365 |
|
7 years |
ZeniMax Media Inc.
On March 9, 2021, we completed our acquisition of ZeniMax Media Inc. (“ZeniMax”), the parent company of Bethesda Softworks LLC (“Bethesda”), for a total purchase price of $8.1 billion, consisting primarily of cash. The purchase price included $766 million of cash and cash equivalents acquired. Bethesda is one of the largest, privately held game developers and publishers in the world, and brings a broad portfolio of games, technology, and talent to Xbox. The financial results of ZeniMax have been included in our consolidated financial statements since the date of the acquisition. ZeniMax is reported as part of our More Personal Computing segment.
The allocation of the purchase price to goodwill was completed as of December 31, 2021. The major classes of assets and liabilities to which we have allocated the purchase price were as follows:
| (In millions) |
| Cash and cash equivalents |
$ 766 |
| Goodwill |
5,510 |
| Intangible assets |
1,968 |
| Other assets |
121 |
| Other liabilities |
(244) |
| Total |
$ 8,121 |
Goodwill was assigned to our More Personal Computing segment. The goodwill was primarily attributed to increased synergies that are expected to be achieved from the integration of ZeniMax. None of the goodwill is expected to be deductible for income tax purposes.
Following are details of the purchase price allocated to the intangible assets acquired:
| (In millions, except average life) |
Amount |
|
Weighted
Average Life |
| Technology-based |
$ 1,341 |
|
4 years |
| Marketing-related |
627 |
|
11 years |
| Total |
$ 1,968 |
|
6 years |
Activision Blizzard, Inc.
On January 18, 2022, we entered into a definitive agreement to acquire Activision Blizzard, Inc. (“Activision Blizzard”) for $95.00 per share in an all-cash transaction valued at $68.7 billion, inclusive of Activision Blizzard’s net cash. Activision Blizzard is a leader in game development and an interactive entertainment content publisher. The acquisition will accelerate the growth in our gaming business across mobile, PC, console, and cloud gaming. The acquisition has been approved by Activision Blizzard’s shareholders. We continue to work toward closing the transaction subject to obtaining required regulatory approvals and satisfaction of other customary closing conditions. Microsoft and Activision Blizzard have jointly agreed to extend the merger agreement through October 18, 2023 to allow for additional time to resolve remaining regulatory concerns.
NOTE 9 — GOODWILL
Changes in the carrying amount of goodwill were as follows:
| (In millions) |
June 30,
2021 |
|
Acquisitions |
|
Other |
|
June 30,
2022 |
|
Acquisitions |
|
Other |
|
June 30,
2023 |
| Productivity and Business Processes |
$ 24,317 |
|
$ 599 |
|
$ (105) |
|
$ 24,811 |
|
$ 11 |
|
$ (47) |
|
$ 24,775 |
| Intelligent Cloud |
13,256 |
|
16,879 |
|
47 |
|
30,182 |
|
223 |
|
64 |
|
30,469 |
| More Personal Computing |
12,138 |
|
648 |
|
(255) |
|
12,531 |
|
0 |
|
111 |
|
12,642 |
| Total |
$ 49,711 |
|
$ 18,126 |
|
$ (313) |
|
$ 67,524 |
|
$ 234 |
|
$ 128 |
|
$ 67,886 |
The measurement periods for the valuation of assets acquired and liabilities assumed end as soon as information on the facts and circumstances that existed as of the acquisition dates becomes available, but do not exceed 12 months. Adjustments in purchase price allocations may require a change in the amounts allocated to goodwill during the periods in which the adjustments are determined.
Any change in the goodwill amounts resulting from foreign currency translations and purchase accounting adjustments are presented as “Other” in the table above. Also included in “Other” are business dispositions and transfers between segments due to reorganizations, as applicable.
Goodwill Impairment
We test goodwill for impairment annually on May 1 at the reporting unit level, primarily using a discounted cash flow methodology with a peer-based, risk-adjusted weighted average cost of capital. We believe use of a discounted cash flow approach is the most reliable indicator of the fair values of the businesses.
No instances of impairment were identified in our May 1, 2023, May 1, 2022, or May 1, 2021 tests. As of June 30, 2023 and 2022, accumulated goodwill impairment was $11.3 billion.
NOTE 10 — INTANGIBLE ASSETS
The components of intangible assets, all of which are finite-lived, were as follows:
| (In millions) |
Gross
Carrying
Amount |
|
Accumulated
Amortization |
|
Net Carrying
Amount |
|
Gross
Carrying
Amount |
|
Accumulated
Amortization |
|
Net Carrying
Amount |
| June 30, |
|
|
|
|
2023 |
|
|
|
|
|
2022 |
| Technology-based |
$ 11,245 |
|
$ (7,589) |
|
$ 3,656 |
|
$ 11,277 |
|
$ (6,958) |
|
$ 4,319 |
| Customer-related |
7,281 |
|
(4,047) |
|
3,234 |
|
7,342 |
|
(3,171) |
|
4,171 |
| Marketing-related |
4,935 |
|
(2,473) |
|
2,462 |
|
4,942 |
|
(2,143) |
|
2,799 |
| Contract-based |
29 |
|
(15) |
|
14 |
|
16 |
|
(7) |
|
9 |
| Total |
$ 23,490 |
|
$ (14,124) |
|
$ 9,366 |
|
$ 23,577 |
|
$ (12,279) |
|
$ 11,298 |
No material impairments of intangible assets were identified during fiscal years 2023, 2022, or 2021. We estimate that we have no significant residual value related to our intangible assets.
The components of intangible assets acquired during the periods presented were as follows:
| (In millions) |
|
Amount |
Weighted
Average Life |
|
Amount |
Weighted
Average Life |
| Year Ended June 30, |
|
2023 |
|
|
2022 |
|
| Technology-based |
|
$ 522 |
7 years |
|
$ 2,611 |
4 years |
| Customer-related |
|
0 |
0 years |
|
2,837 |
9 years |
| Marketing-related |
|
7 |
5 years |
|
233 |
4 years |
| Contract-based |
|
12 |
3 years |
|
0 |
0 years |
| Total |
|
$ 541 |
6 years |
|
$ 5,681 |
7 years |
Intangible assets amortization expense was $2.5 billion, $2.0 billion, and $1.6 billion for fiscal years 2023, 2022, and 2021, respectively.
The following table outlines the estimated future amortization expense related to intangible assets held as of June 30, 2023:
| (In millions) |
|
| Year Ending June 30, |
|
| 2024 |
$ 2,363 |
| 2025 |
1,881 |
| 2026 |
1,381 |
| 2027 |
929 |
| 2028 |
652 |
| Thereafter |
2,160 |
| Total |
$ 9,366 |
NOTE 11 — DEBT
The components of debt were as follows:
| (In millions, issuance by calendar year) |
Maturities
(calendar year) |
|
Stated Interest
Rate |
|
Effective Interest
Rate |
|
June 30,
2023 |
|
June 30,
2022 |
| 2009 issuance of $3.8 billion |
2039 |
|
5.20% |
|
5.24% |
|
$ 520 |
|
$ 520 |
| 2010 issuance of $4.8 billion |
2040 |
|
4.50% |
|
4.57% |
|
486 |
|
486 |
| 2011 issuance of $2.3 billion |
2041 |
|
5.30% |
|
5.36% |
|
718 |
|
718 |
| 2012 issuance of $2.3 billion |
2042 |
|
3.50% |
|
3.57% |
|
454 |
|
1,204 |
| 2013 issuance of $5.2 billion |
2023–2043 |
|
3.63%–4.88% |
|
3.73%–4.92% |
|
1,814 |
|
2,814 |
| 2013 issuance of €4.1 billion |
2028–2033 |
|
2.63%–3.13% |
|
2.69%–3.22% |
|
2,509 |
|
2,404 |
| 2015 issuance of $23.8 billion |
2025–2055 |
|
2.70%–4.75% |
|
2.77%–4.78% |
|
9,805 |
|
10,805 |
| 2016 issuance of $19.8 billion |
2023–2056 |
|
2.00%–3.95% |
|
2.10%–4.03% |
|
9,430 |
|
9,430 |
| 2017 issuance of $17.0 billion |
2024–2057 |
|
2.88%–4.50% |
|
3.04%–4.53% |
|
8,945 |
|
8,945 |
| 2020 issuance of $10.0 billion |
2050–2060 |
|
2.53%–2.68% |
|
2.53%–2.68% |
|
10,000 |
|
10,000 |
| 2021 issuance of $8.2 billion |
2052–2062 |
|
2.92%–3.04% |
|
2.92%–3.04% |
|
8,185 |
|
8,185 |
| Total face value |
52,866 |
|
55,511 |
| Unamortized discount and issuance costs |
(438) |
|
(471) |
| Hedge fair value adjustments (a) |
(106) |
|
(68) |
| Premium on debt exchange |
(5,085) |
|
(5,191) |
| Total debt |
47,237 |
|
49,781 |
| Current portion of long-term debt |
(5,247) |
|
(2,749) |
| Long-term debt |
$ 41,990 |
|
$ 47,032 |
- Refer to Note 5 – Derivatives for further information on the interest rate swaps related to fixed-rate debt.
As of June 30, 2023 and 2022, the estimated fair value of long-term debt, including the current portion, was $46.2 billion and $50.9 billion, respectively. The estimated fair values are based on Level 2 inputs.
Debt in the table above is comprised of senior unsecured obligations and ranks equally with our other outstanding obligations. Interest is paid semi-annually, except for the Euro-denominated debt, which is paid annually. Cash paid for interest on our debt for fiscal years 2023, 2022, and 2021 was $1.7 billion, $1.9 billion, and $2.0 billion, respectively.
The following table outlines maturities of our long-term debt, including the current portion, as of June 30, 2023:
| (In millions) |
|
| Year Ending June 30, |
|
| 2024 |
$ 5,250 |
| 2025 |
2,250 |
| 2026 |
3,000 |
| 2027 |
8,000 |
| 2028 |
0 |
| Thereafter |
34,366 |
| Total |
$ 52,866 |
NOTE 12 — INCOME TAXES
Provision for Income Taxes
The components of the provision for income taxes were as follows:
| (In millions) |
|
|
|
|
|
| Year Ended June 30, |
2023 |
|
2022 |
|
2021 |
| Current Taxes |
|
|
|
|
|
| U.S. federal |
$ 14,009 |
|
$ 8,329 |
|
$ 3,285 |
| U.S. state and local |
2,322 |
|
1,679 |
|
1,229 |
| Foreign |
6,678 |
|
6,672 |
|
5,467 |
| Current taxes |
$ 23,009 |
|
$ 16,680 |
|
$ 9,981 |
| Deferred Taxes |
|
|
|
|
|
| U.S. federal |
$ (6,146) |
|
$ (4,815) |
|
$ 25 |
| U.S. state and local |
(477) |
|
(1,062) |
|
(204) |
| Foreign |
564 |
|
175 |
|
29 |
| Deferred taxes |
$ (6,059) |
|
$ (5,702) |
|
$ (150) |
| Provision for income taxes |
$ 16,950 |
|
$ 10,978 |
|
$ 9,831 |
U.S. and foreign components of income before income taxes were as follows:
| (In millions) |
|
|
|
|
|
| Year Ended June 30, |
2023 |
|
2022 |
|
2021 |
| U.S. |
$ 52,917 |
|
$ 47,837 |
|
$ 34,972 |
| Foreign |
36,394 |
|
35,879 |
|
36,130 |
| Income before income taxes |
$ 89,311 |
|
$ 83,716 |
|
$ 71,102 |
Effective Tax Rate
The items accounting for the difference between income taxes computed at the U.S. federal statutory rate and our effective rate were as follows:
|
| Year Ended June 30, |
2023 |
|
2022 |
|
2021 |
| Federal statutory rate |
21.0% |
|
21.0% |
|
21.0% |
| Effect of: |
|
|
|
|
|
| Foreign earnings taxed at lower rates |
(1.8)% |
|
(1.3)% |
|
(2.7)% |
| Impact of intangible property transfers |
0% |
|
(3.9)% |
|
0% |
| Foreign-derived intangible income deduction |
(1.3)% |
|
(1.1)% |
|
(1.3)% |
| State income taxes, net of federal benefit |
1.6% |
|
1.4% |
|
1.4% |
| Research and development credit |
(1.1)% |
|
(0.9)% |
|
(0.9)% |
| Excess tax benefits relating to stock-based compensation |
(0.7)% |
|
(1.9)% |
|
(2.4)% |
| Interest, net |
0.8% |
|
0.5% |
|
0.5% |
| Other reconciling items, net |
0.5% |
|
(0.7)% |
|
(1.8)% |
| Effective rate |
19.0% |
|
13.1% |
|
13.8% |
In the first quarter of fiscal year 2022, we transferred certain intangible properties from our Puerto Rico subsidiary to the U.S. The transfer of intangible properties resulted in a $3.3 billion net income tax benefit in the first quarter of fiscal year 2022, as the value of future U.S. tax deductions exceeded the current tax liability from the U.S. global intangible low-taxed income (“GILTI”) tax.
We have historically paid India withholding taxes on software sales through distributor withholding and tax audit assessments in India. In March 2021, the India Supreme Court ruled favorably in the case of Engineering Analysis Centre of Excellence Private Limited vs The Commissioner of Income Tax for companies in 86 separate appeals, some dating back to 2012, holding that software sales are not subject to India withholding taxes. Although we were not a party to the appeals, our software sales in India were determined to be not subject to withholding taxes. Therefore, we recorded a net income tax benefit of $620 million in the third quarter of fiscal year 2021 to reflect the results of the India Supreme Court decision impacting fiscal year 1996 through fiscal year 2016.
The decrease from the federal statutory rate in fiscal year 2023 is primarily due to earnings taxed at lower rates in foreign jurisdictions resulting from producing and distributing our products and services through our foreign regional operations center in Ireland. The decrease from the federal statutory rate in fiscal year 2022 is primarily due to the net income tax benefit related to the transfer of intangible properties, earnings taxed at lower rates in foreign jurisdictions resulting from producing and distributing our products and services through our foreign regional operations center in Ireland, and tax benefits relating to stock-based compensation. The decrease from the federal statutory rate in fiscal year 2021 is primarily due to earnings taxed at lower rates in foreign jurisdictions resulting from producing and distributing our products and services through our foreign regional operations centers in Ireland and Puerto Rico, tax benefits relating to stock-based compensation, and tax benefits from the India Supreme Court decision on withholding taxes. In fiscal year 2023, our foreign regional operating center in Ireland, which is taxed at a rate lower than the U.S. rate, generated 81% of our foreign income before tax. In fiscal years 2022 and 2021, our foreign regional operating centers in Ireland and Puerto Rico, which are taxed at rates lower than the U.S. rate, generated 71% and 82% of our foreign income before tax. Other reconciling items, net consists primarily of tax credits and GILTI tax, and in fiscal year 2021, includes tax benefits from the India Supreme Court decision on withholding taxes. In fiscal years 2023, 2022, and 2021, there were no individually significant other reconciling items.
The increase in our effective tax rate for fiscal year 2023 compared to fiscal year 2022 was primarily due to a $3.3 billion net income tax benefit in the first quarter of fiscal year 2022 related to the transfer of intangible properties and a decrease in tax benefits relating to stock-based compensation. The decrease in our effective tax rate for fiscal year 2022 compared to fiscal year 2021 was primarily due to a $3.3 billion net income tax benefit in the first quarter of fiscal year 2022 related to the transfer of intangible properties, offset in part by changes in the mix of our income before income taxes between the U.S. and foreign countries, as well as tax benefits in the prior year from the India Supreme Court decision on withholding taxes, an agreement between the U.S. and India tax authorities related to transfer pricing, and final Tax Cuts and Jobs Act (“TCJA”) regulations.
The components of the deferred income tax assets and liabilities were as follows:
| (In millions) |
|
|
|
| June 30, |
2023 |
|
2022 |
| Deferred Income Tax Assets |
|
|
|
| Stock-based compensation expense |
$ 681 |
|
$ 601 |
| Accruals, reserves, and other expenses |
3,131 |
|
2,874 |
| Loss and credit carryforwards |
1,441 |
|
1,546 |
| Amortization (a) |
9,440 |
|
10,183 |
| Leasing liabilities |
5,041 |
|
4,557 |
| Unearned revenue |
3,296 |
|
2,876 |
| Book/tax basis differences in investments and debt |
373 |
|
0 |
| Capitalized research and development (a) |
6,958 |
|
473 |
| Other |
489 |
|
461 |
| Deferred income tax assets |
30,850 |
|
23,571 |
| Less valuation allowance |
(939) |
|
(1,012) |
| Deferred income tax assets, net of valuation allowance |
$ 29,911 |
|
$ 22,559 |
| Deferred Income Tax Liabilities |
|
|
|
| Book/tax basis differences in investments and debt |
$ 0 |
|
$ (174) |
| Leasing assets |
(4,680) |
|
(4,291) |
| Depreciation |
(2,674) |
|
(1,602) |
| Deferred tax on foreign earnings |
(2,738) |
|
(3,104) |
| Other |
(89) |
|
(103) |
| Deferred income tax liabilities |
$ (10,181) |
|
$ (9,274) |
| Net deferred income tax assets |
$ 19,730 |
|
$ 13,285 |
| Reported As |
|
|
|
| Other long-term assets |
$ 20,163 |
|
$ 13,515 |
| Long-term deferred income tax liabilities |
(433) |
|
(230) |
| Net deferred income tax assets |
$ 19,730 |
|
$ 13,285 |
- Provisions enacted in the TCJA related to the capitalization for tax purposes of research and development expenditures became effective on July 1, 2022. These provisions require us to capitalize research and development expenditures and amortize them on our U.S. tax return over five or fifteen years, depending on where research is conducted.
Deferred income tax balances reflect the effects of temporary differences between the carrying amounts of assets and liabilities and their tax bases and are stated at enacted tax rates expected to be in effect when the taxes are paid or recovered.
As of June 30, 2023, we had federal, state, and foreign net operating loss carryforwards of $509 million, $1.2 billion, and $2.3 billion, respectively. The federal and state net operating loss carryforwards have varying expiration dates ranging from fiscal year 2024 to 2043 or indefinite carryforward periods, if not utilized. The majority of our foreign net operating loss carryforwards do not expire. Certain acquired net operating loss carryforwards are subject to an annual limitation but are expected to be realized with the exception of those which have a valuation allowance. As of June 30, 2023, we had $456 million federal capital loss carryforwards for U.S. tax purposes from our acquisition of Nuance. The federal capital loss carryforwards are subject to an annual limitation and will expire in fiscal year 2025.
The valuation allowance disclosed in the table above relates to the foreign net operating loss carryforwards, federal capital loss carryforwards, and other net deferred tax assets that may not be realized.
Income taxes paid, net of refunds, were $23.1 billion, $16.0 billion, and $13.4 billion in fiscal years 2023, 2022, and 2021, respectively.
Uncertain Tax Positions
Gross unrecognized tax benefits related to uncertain tax positions as of June 30, 2023, 2022, and 2021, were $17.1 billion, $15.6 billion, and $14.6 billion, respectively, which were primarily included in long-term income taxes in our consolidated balance sheets. If recognized, the resulting tax benefit would affect our effective tax rates for fiscal years 2023, 2022, and 2021 by $14.4 billion, $13.3 billion, and $12.5 billion, respectively.
As of June 30, 2023, 2022, and 2021, we had accrued interest expense related to uncertain tax positions of $5.2 billion, $4.3 billion, and $4.3 billion, respectively, net of income tax benefits. The provision for income taxes for fiscal years 2023, 2022, and 2021 included interest expense related to uncertain tax positions of $918 million, $36 million, and $274 million, respectively, net of income tax benefits.
The aggregate changes in the gross unrecognized tax benefits related to uncertain tax positions were as follows:
| (In millions) |
|
|
|
|
|
| Year Ended June 30, |
2023 |
|
2022 |
|
2021 |
| Beginning unrecognized tax benefits |
$ 15,593 |
|
$ 14,550 |
|
$ 13,792 |
| Decreases related to settlements |
(329) |
|
(317) |
|
(195) |
| Increases for tax positions related to the current year |
1,051 |
|
1,145 |
|
790 |
| Increases for tax positions related to prior years |
870 |
|
461 |
|
461 |
| Decreases for tax positions related to prior years |
(60) |
|
(246) |
|
(297) |
| Decreases due to lapsed statutes of limitations |
(5) |
|
0 |
|
(1) |
| Ending unrecognized tax benefits |
$ 17,120 |
|
$ 15,593 |
|
$ 14,550 |
We settled a portion of the Internal Revenue Service (“IRS”) audit for tax years 2004 to 2006 in fiscal year 2011. In February 2012, the IRS withdrew its 2011 Revenue Agents Report related to unresolved issues for tax years 2004 to 2006 and reopened the audit phase of the examination. We also settled a portion of the IRS audit for tax years 2007 to 2009 in fiscal year 2016, and a portion of the IRS audit for tax years 2010 to 2013 in fiscal year 2018. In the second quarter of fiscal year 2021, we settled an additional portion of the IRS audits for tax years 2004 to 2013 and made a payment of $1.7 billion, including tax and interest. We remain under audit for tax years 2004 to 2017.
As of June 30, 2023, the primary unresolved issues for the IRS audits relate to transfer pricing, which could have a material impact in our consolidated financial statements when the matters are resolved. We believe our allowances for income tax contingencies are adequate. We have not received a proposed assessment for the unresolved key transfer pricing issues. We do not expect a final resolution of these issues in the next 12 months. Based on the information currently available, we do not anticipate a significant increase or decrease to our tax contingencies for these issues within the next 12 months.
We are subject to income tax in many jurisdictions outside the U.S. Our operations in certain jurisdictions remain subject to examination for tax years 1996 to 2022, some of which are currently under audit by local tax authorities. The resolution of each of these audits is not expected to be material to our consolidated financial statements.
NOTE 13 — UNEARNED REVENUE
Unearned revenue by segment was as follows:
| (In millions) |
|
|
|
| June 30, |
2023 |
|
2022 |
| Productivity and Business Processes |
$ 27,572 |
|
$ 24,558 |
| Intelligent Cloud |
21,563 |
|
19,371 |
| More Personal Computing |
4,678 |
|
4,479 |
| Total |
$ 53,813 |
|
$ 48,408 |
Changes in unearned revenue were as follows:
| (In millions) |
|
|
| Year Ended June 30, 2023 |
|
|
| Balance, beginning of period |
|
$ 48,408 |
| Deferral of revenue |
|
123,935 |
| Recognition of unearned revenue |
|
(118,530) |
| Balance, end of period |
|
$ 53,813 |
Revenue allocated to remaining performance obligations, which includes unearned revenue and amounts that will be invoiced and recognized as revenue in future periods, was $229 billion as of June 30, 2023, of which $224 billion is related to the commercial portion of revenue. We expect to recognize approximately 45% of this revenue over the next 12 months and the remainder thereafter.
NOTE 14 — LEASES
We have operating and finance leases for datacenters, corporate offices, research and development facilities, Microsoft Experience Centers, and certain equipment. Our leases have remaining lease terms of less than 1 year to 18 years, some of which include options to extend the leases for up to 5 years, and some of which include options to terminate the leases within 1 year.
The components of lease expense were as follows:
| (In millions) |
|
|
|
|
|
| Year Ended June 30, |
2023 |
|
2022 |
|
2021 |
| Operating lease cost |
$ 2,875 |
|
$ 2,461 |
|
$ 2,127 |
| Finance lease cost: |
|
|
|
|
|
| Amortization of right-of-use assets |
$ 1,352 |
|
$ 980 |
|
$ 921 |
| Interest on lease liabilities |
501 |
|
429 |
|
386 |
| Total finance lease cost |
$ 1,853 |
|
$ 1,409 |
|
$ 1,307 |
Supplemental cash flow information related to leases was as follows:
| (In millions) |
|
|
|
|
|
| Year Ended June 30, |
2023 |
|
2022 |
|
2021 |
| Cash paid for amounts included in the measurement of lease liabilities: |
|
|
|
|
|
| Operating cash flows from operating leases |
$ 2,706 |
|
$ 2,368 |
|
$ 2,052 |
| Operating cash flows from finance leases |
501 |
|
429 |
|
386 |
| Financing cash flows from finance leases |
1,056 |
|
896 |
|
648 |
| Right-of-use assets obtained in exchange for lease obligations: |
|
|
|
|
|
| Operating leases |
3,514 |
|
5,268 |
|
4,380 |
| Finance leases |
3,128 |
|
4,234 |
|
3,290 |
Supplemental balance sheet information related to leases was as follows:
| (In millions, except lease term and discount rate) |
|
|
|
| June 30, |
2023 |
|
2022 |
| Operating Leases |
|
|
|
| Operating lease right-of-use assets |
$ 14,346 |
|
$ 13,148 |
| Other current liabilities |
$ 2,409 |
|
$ 2,228 |
| Operating lease liabilities |
12,728 |
|
11,489 |
| Total operating lease liabilities |
$ 15,137 |
|
$ 13,717 |
| Finance Leases |
|
|
|
| Property and equipment, at cost |
$ 20,538 |
|
$ 17,388 |
| Accumulated depreciation |
(4,647) |
|
(3,285) |
| Property and equipment, net |
$ 15,891 |
|
$ 14,103 |
| Other current liabilities |
$ 1,197 |
|
$ 1,060 |
| Other long-term liabilities |
15,870 |
|
13,842 |
| Total finance lease liabilities |
$ 17,067 |
|
$ 14,902 |
| Weighted Average Remaining Lease Term |
|
|
|
| Operating leases |
8 years |
|
8 years |
| Finance leases |
11 years |
|
12 years |
| Weighted Average Discount Rate |
|
|
|
| Operating leases |
2.9% |
|
2.1% |
| Finance leases |
3.4% |
|
3.1% |
The following table outlines maturities of our lease liabilities as of June 30, 2023:
| (In millions) |
|
|
|
| Year Ending June 30, |
Operating
Leases |
|
Finance
Leases |
| 2024 |
$ 2,784 |
|
$ 1,747 |
| 2025 |
2,508 |
|
2,087 |
| 2026 |
2,142 |
|
1,771 |
| 2027 |
1,757 |
|
1,780 |
| 2028 |
1,582 |
|
1,787 |
| Thereafter |
6,327 |
|
11,462 |
| Total lease payments |
17,100 |
|
20,634 |
| Less imputed interest |
(1,963) |
|
(3,567) |
| Total |
$ 15,137 |
|
$ 17,067 |
As of June 30, 2023, we have additional operating and finance leases, primarily for datacenters, that have not yet commenced of $7.7 billion and $34.4 billion, respectively. These operating and finance leases will commence between fiscal year 2024 and fiscal year 2030 with lease terms of 1 year to 18 years.
NOTE 15 — CONTINGENCIES
U.S. Cell Phone Litigation
Microsoft Mobile Oy, a subsidiary of Microsoft, along with other handset manufacturers and network operators, is a defendant in 46 lawsuits, including 45 lawsuits filed in the Superior Court for the District of Columbia by individual plaintiffs who allege that radio emissions from cellular handsets caused their brain tumors and other adverse health effects. We assumed responsibility for these claims in our agreement to acquire Nokia’s Devices and Services business and have been substituted for the Nokia defendants. Nine of these cases were filed in 2002 and are consolidated for certain pre-trial proceedings; the remaining cases are stayed. In a separate 2009 decision, the Court of Appeals for the District of Columbia held that adverse health effect claims arising from the use of cellular handsets that operate within the U.S. Federal Communications Commission radio frequency emission guidelines (“FCC Guidelines”) are pre-empted by federal law. The plaintiffs allege that their handsets either operated outside the FCC Guidelines or were manufactured before the FCC Guidelines went into effect. The lawsuits also allege an industry-wide conspiracy to manipulate the science and testing around emission guidelines.
In 2013, the defendants in the consolidated cases moved to exclude the plaintiffs’ expert evidence of general causation on the basis of flawed scientific methodologies. In 2014, the trial court granted in part and denied in part the defendants’ motion to exclude the plaintiffs’ general causation experts. The defendants filed an interlocutory appeal to the District of Columbia Court of Appeals challenging the standard for evaluating expert scientific evidence. In October 2016, the Court of Appeals issued its decision adopting the standard advocated by the defendants and remanding the cases to the trial court for further proceedings under that standard. The plaintiffs have filed supplemental expert evidence, portions of which were stricken by the court. A hearing on general causation took place in September of 2022. In April of 2023, the court granted defendants’ motion to strike the testimony of plaintiffs’ experts that cell phones cause brain cancer and entered an order excluding all of plaintiffs’ experts from testifying.
Irish Data Protection Commission Matter
In 2018, the Irish Data Protection Commission (“IDPC”) began investigating a complaint against LinkedIn as to whether LinkedIn’s targeted advertising practices violated the recently implemented European Union General Data Protection Regulation (“GDPR”). Microsoft cooperated throughout the period of inquiry. In April 2023, the IDPC provided LinkedIn with a non-public preliminary draft decision alleging GDPR violations and proposing a fine. Microsoft intends to challenge the preliminary draft decision. There is no set timeline for the IDPC to issue a final decision.
Other Contingencies
We also are subject to a variety of other claims and suits that arise from time to time in the ordinary course of our business. Although management currently believes that resolving claims against us, individually or in aggregate, will not have a material adverse impact in our consolidated financial statements, these matters are subject to inherent uncertainties and management’s view of these matters may change in the future.
As of June 30, 2023, we accrued aggregate legal liabilities of $617 million. While we intend to defend these matters vigorously, adverse outcomes that we estimate could reach approximately $600 million in aggregate beyond recorded amounts are reasonably possible. Were unfavorable final outcomes to occur, there exists the possibility of a material adverse impact in our consolidated financial statements for the period in which the effects become reasonably estimable.
NOTE 16 — STOCKHOLDERS’ EQUITY
Shares Outstanding
Shares of common stock outstanding were as follows:
| (In millions) |
|
|
|
|
|
| Year Ended June 30, |
2023 |
|
2022 |
|
2021 |
| Balance, beginning of year |
7,464 |
|
7,519 |
|
7,571 |
| Issued |
37 |
|
40 |
|
49 |
| Repurchased |
(69) |
|
(95) |
|
(101) |
| Balance, end of year |
7,432 |
|
7,464 |
|
7,519 |
Share Repurchases
On September 18, 2019, our Board of Directors approved a share repurchase program authorizing up to $40.0 billion in share repurchases. This share repurchase program commenced in February 2020 and was completed in November 2021.
On September 14, 2021, our Board of Directors approved a share repurchase program authorizing up to $60.0 billion in share repurchases. This share repurchase program commenced in November 2021, following completion of the program approved on September 18, 2019, has no expiration date, and may be terminated at any time. As of June 30, 2023, $22.3 billion remained of this $60.0 billion share repurchase program.
We repurchased the following shares of common stock under the share repurchase programs:
| (In millions) |
Shares |
|
Amount |
|
Shares |
|
Amount |
|
Shares |
|
Amount |
| Year Ended June 30, |
2023 |
2022 |
2021 |
| First Quarter |
17 |
|
$ 4,600 |
|
21 |
|
$ 6,200 |
|
25 |
|
$ 5,270 |
| Second Quarter |
20 |
|
4,600 |
|
20 |
|
6,233 |
|
27 |
|
5,750 |
| Third Quarter |
18 |
|
4,600 |
|
26 |
|
7,800 |
|
25 |
|
5,750 |
| Fourth Quarter |
14 |
|
4,600 |
|
28 |
|
7,800 |
|
24 |
|
6,200 |
| Total |
69 |
|
$ 18,400 |
|
95 |
|
$ 28,033 |
|
101 |
|
$ 22,970 |
All repurchases were made using cash resources. Shares repurchased during fiscal year 2023 and the fourth and third quarters of fiscal year 2022 were under the share repurchase program approved on September 14, 2021. Shares repurchased during the second quarter of fiscal year 2022 were under the share repurchase programs approved on both September 14, 2021 and September 18, 2019. All other shares repurchased were under the share repurchase program approved on September 18, 2019. The above table excludes shares repurchased to settle employee tax withholding related to the vesting of stock awards of $3.8 billion, $4.7 billion, and $4.4 billion for fiscal years 2023, 2022, and 2021, respectively.
Dividends
Our Board of Directors declared the following dividends:
| Declaration Date |
Record Date |
Payment Date |
|
Dividend
Per Share |
|
Amount |
| Fiscal Year 2023 |
|
|
|
|
|
(In millions) |
| September 20, 2022 |
November 17, 2022 |
December 8, 2022 |
|
$ 0.68 |
|
$ 5,066 |
| November 29, 2022 |
February 16, 2023 |
March 9, 2023 |
|
0.68 |
|
5,059 |
| March 14, 2023 |
May 18, 2023 |
June 8, 2023 |
|
0.68 |
|
5,054 |
| June 13, 2023 |
August 17, 2023 |
September 14, 2023 |
|
0.68 |
|
5,054 |
| Total |
|
|
|
$ 2.72 |
|
$ 20,233 |
| Fiscal Year 2022 |
|
|
|
|
|
|
| September 14, 2021 |
November 18, 2021 |
December 9, 2021 |
|
$ 0.62 |
|
$ 4,652 |
| December 7, 2021 |
February 17, 2022 |
March 10, 2022 |
|
0.62 |
|
4,645 |
| March 14, 2022 |
May 19, 2022 |
June 9, 2022 |
|
0.62 |
|
4,632 |
| June 14, 2022 |
August 18, 2022 |
September 8, 2022 |
|
0.62 |
|
4,621 |
| Total |
|
|
|
$ 2.48 |
|
$ 18,550 |
The dividend declared on June 13, 2023 was included in other current liabilities as of June 30, 2023.
NOTE 17 — ACCUMULATED OTHER COMPREHENSIVE INCOME (LOSS)
The following table summarizes the changes in accumulated other comprehensive income (loss) by component:
| (In millions) |
|
|
|
|
|
| Year Ended June 30, |
2023 |
|
2022 |
|
2021 |
| Derivatives |
|
|
|
|
|
| Balance, beginning of period |
$ (13) |
|
$ (19) |
|
$ (38) |
| Unrealized gains (losses), net of tax of $9, $(15), and $9 |
34 |
|
(57) |
|
34 |
| Reclassification adjustments for (gains) losses included in other income (expense), net |
(61) |
|
79 |
|
(17) |
| Tax expense (benefit) included in provision for income taxes |
13 |
|
(16) |
|
2 |
| Amounts reclassified from accumulated other comprehensive income (loss) |
(48) |
|
63 |
|
(15) |
| Net change related to derivatives, net of tax of $(4), $1, and $7 |
(14) |
|
6 |
|
19 |
| Balance, end of period |
$ (27) |
|
$ (13) |
|
$ (19) |
| Investments |
|
|
|
|
|
| Balance, beginning of period |
$ (2,138) |
|
$ 3,222 |
|
$ 5,478 |
| Unrealized losses, net of tax of $(393), $(1,440), and $(589) |
(1,523) |
|
(5,405) |
|
(2,216) |
| Reclassification adjustments for (gains) losses included in other income (expense), net |
99 |
|
57 |
|
(63) |
| Tax expense (benefit) included in provision for income taxes |
(20) |
|
(12) |
|
13 |
| Amounts reclassified from accumulated other comprehensive income (loss) |
79 |
|
45 |
|
(50) |
| Net change related to investments, net of tax of $(373), $(1,428), and $(602) |
(1,444) |
|
(5,360) |
|
(2,266) |
| Cumulative effect of accounting changes |
0 |
|
0 |
|
10 |
| Balance, end of period |
$ (3,582) |
|
$ (2,138) |
|
$ 3,222 |
| Translation Adjustments and Other |
|
|
|
|
|
| Balance, beginning of period |
$ (2,527) |
|
$ (1,381) |
|
$ (2,254) |
| Translation adjustments and other, net of tax of $0, $0, and $(9) |
(207) |
|
(1,146) |
|
873 |
| Balance, end of period |
$ (2,734) |
|
$ (2,527) |
|
$ (1,381) |
| Accumulated other comprehensive income (loss), end of period |
$ (6,343) |
|
$ (4,678) |
|
$ 1,822 |
NOTE 18 — EMPLOYEE STOCK AND SAVINGS PLANS
We grant stock-based compensation to employees and directors. Awards that expire or are canceled without delivery of shares generally become available for issuance under the plans. We issue new shares of Microsoft common stock to satisfy vesting of awards granted under our stock plans. We also have an ESPP for all eligible employees.
Stock-based compensation expense and related income tax benefits were as follows:
| (In millions) |
|
|
|
|
|
| Year Ended June 30, |
2023 |
|
2022 |
|
2021 |
| Stock-based compensation expense |
$ 9,611 |
|
$ 7,502 |
|
$ 6,118 |
| Income tax benefits related to stock-based compensation |
1,651 |
|
1,293 |
|
1,065 |
Stock Plans
Stock awards entitle the holder to receive shares of Microsoft common stock as the award vests. Stock awards generally vest over a service period of four years or five years.
Executive Incentive Plan
Under the Executive Incentive Plan, the Compensation Committee approves stock awards to executive officers and certain senior executives. RSUs generally vest ratably over a service period of four years. PSUs generally vest over a performance period of three years. The number of shares the PSU holder receives is based on the extent to which the corresponding performance goals have been achieved.
Activity for All Stock Plans
The fair value of stock awards was estimated on the date of grant using the following assumptions:
|
|
|
|
|
|
| Year Ended June 30, |
2023 |
|
2022 |
|
2021 |
| Dividends per share (quarterly amounts) |
$ 0.62 – 0.68 |
|
$ 0.56 – 0.62 |
|
$ 0.51 – 0.56 |
| Interest rates |
2.0% – 5.4% |
|
0.03% – 3.6% |
|
0.01% – 1.5% |
During fiscal year 2023, the following activity occurred under our stock plans:
| Shares |
|
Weighted
Average
Grant-Date
Fair Value |
|
(In millions) |
|
|
| Stock Awards |
|
|
|
| Nonvested balance, beginning of year |
93 |
|
$ 227.59 |
| Granted (a) |
56 |
|
252.59 |
| Vested |
(44) |
|
206.90 |
| Forfeited |
(9) |
|
239.93 |
| Nonvested balance, end of year |
96 |
|
$ 250.37 |
- Includes 1 million, 1 million, and 2 million of PSUs granted at target and performance adjustments above target levels for fiscal years 2023, 2022, and 2021, respectively.
As of June 30, 2023, total unrecognized compensation costs related to stock awards were $18.6 billion. These costs are expected to be recognized over a weighted average period of three years. The weighted average grant-date fair value of stock awards granted was $252.59, $291.22, and $221.13 for fiscal years 2023, 2022, and 2021, respectively. The fair value of stock awards vested was $11.9 billion, $14.1 billion, and $13.4 billion, for fiscal years 2023, 2022, and 2021, respectively. As of June 30, 2023, an aggregate of 164 million shares were authorized for future grant under our stock plans.
Employee Stock Purchase Plan
We have an ESPP for all eligible employees. Shares of our common stock may be purchased by employees at three-month intervals at 90% of the fair market value on the last trading day of each three-month period. Employees may purchase shares having a value not exceeding 15% of their gross compensation during an offering period.
Employees purchased the following shares during the periods presented:
| (Shares in millions) |
|
|
|
|
|
| Year Ended June 30, |
2023 |
|
2022 |
|
2021 |
| Shares purchased |
7 |
|
7 |
|
8 |
| Average price per share |
$ 245.59 |
|
$ 259.55 |
|
$ 207.88 |
As of June 30, 2023, 74 million shares of our common stock were reserved for future issuance through the ESPP.
Savings Plans
We have savings plans in the U.S. that qualify under Section 401(k) of the Internal Revenue Code, and a number of savings plans in international locations. Eligible U.S. employees may contribute a portion of their salary into the savings plans, subject to certain limitations. We match a portion of each dollar a participant contributes into the plans. Employer-funded retirement benefits for all plans were $1.6 billion, $1.4 billion, and $1.2 billion in fiscal years 2023, 2022, and 2021, respectively, and were expensed as contributed.
NOTE 19 — SEGMENT INFORMATION AND GEOGRAPHIC DATA
In its operation of the business, management, including our chief operating decision maker, who is also our Chief Executive Officer, reviews certain financial information, including segmented internal profit and loss statements prepared on a basis not consistent with GAAP. During the periods presented, we reported our financial performance based on the following segments: Productivity and Business Processes, Intelligent Cloud, and More Personal Computing.
We have recast certain prior period amounts to conform to the way we internally manage and monitor our business.
Our reportable segments are described below.
Productivity and Business Processes
Our Productivity and Business Processes segment consists of products and services in our portfolio of productivity, communication, and information services, spanning a variety of devices and platforms. This segment primarily comprises:
- Office Commercial (Office 365 subscriptions, the Office 365 portion of Microsoft 365 Commercial subscriptions, and Office licensed on-premises), comprising Office, Exchange, SharePoint, Microsoft Teams, Office 365 Security and Compliance, Microsoft Viva, and Microsoft 365 Copilot.
- Office Consumer, including Microsoft 365 Consumer subscriptions, Office licensed on-premises, and other Office services.
- LinkedIn, including Talent Solutions, Marketing Solutions, Premium Subscriptions, and Sales Solutions.
- Dynamics business solutions, including Dynamics 365, comprising a set of intelligent, cloud-based applications across ERP, CRM (including Customer Insights), Power Apps, and Power Automate; and on-premises ERP and CRM applications.
Intelligent Cloud
Our Intelligent Cloud segment consists of our public, private, and hybrid server products and cloud services that can power modern business and developers. This segment primarily comprises:
- Server products and cloud services, including Azure and other cloud services; SQL Server, Windows Server, Visual Studio, System Center, and related Client Access Licenses (“CALs”); and Nuance and GitHub.
- Enterprise Services, including Enterprise Support Services, Industry Solutions (formerly Microsoft Consulting Services), and Nuance professional services.
More Personal Computing
Our More Personal Computing segment consists of products and services that put customers at the center of the experience with our technology. This segment primarily comprises:
- Windows, including Windows OEM licensing and other non-volume licensing of the Windows operating system; Windows Commercial, comprising volume licensing of the Windows operating system, Windows cloud services, and other Windows commercial offerings; patent licensing; and Windows Internet of Things.
- Devices, including Surface, HoloLens, and PC accessories.
- Gaming, including Xbox hardware and Xbox content and services, comprising first- and third-party content (including games and in-game content), Xbox Game Pass and other subscriptions, Xbox Cloud Gaming, advertising, third-party disc royalties, and other cloud services.
- Search and news advertising, comprising Bing (including Bing Chat), Microsoft News, Microsoft Edge, and third-party affiliates.
Revenue and costs are generally directly attributed to our segments. However, due to the integrated structure of our business, certain revenue recognized and costs incurred by one segment may benefit other segments. Revenue from certain contracts is allocated among the segments based on the relative value of the underlying products and services, which can include allocation based on actual prices charged, prices when sold separately, or estimated costs plus a profit margin. Cost of revenue is allocated in certain cases based on a relative revenue methodology. Operating expenses that are allocated primarily include those relating to marketing of products and services from which multiple segments benefit and are generally allocated based on relative gross margin.
In addition, certain costs are incurred at a corporate level and allocated to our segments. These allocated costs generally include legal, including settlements and fines, information technology, human resources, finance, excise taxes, field selling, shared facilities services, customer service and support, and severance incurred as part of a corporate program. Each allocation is measured differently based on the specific facts and circumstances of the costs being allocated and is generally based on relative gross margin or relative headcount.
Segment revenue and operating income were as follows during the periods presented:
| (In millions) |
|
|
|
|
|
| Year Ended June 30, |
2023 |
|
2022 |
|
2021 |
| Revenue |
|
|
|
|
|
| Productivity and Business Processes |
$ 69,274 |
|
$ 63,364 |
|
$ 53,915 |
| Intelligent Cloud |
87,907 |
|
74,965 |
|
59,728 |
| More Personal Computing |
54,734 |
|
59,941 |
|
54,445 |
| Total |
$ 211,915 |
|
$ 198,270 |
|
$ 168,088 |
| Operating Income |
|
|
|
|
|
| Productivity and Business Processes |
$ 34,189 |
|
$ 29,690 |
|
$ 24,351 |
| Intelligent Cloud |
37,884 |
|
33,203 |
|
26,471 |
| More Personal Computing |
16,450 |
|
20,490 |
|
19,094 |
| Total |
$ 88,523 |
|
$ 83,383 |
|
$ 69,916 |
No sales to an individual customer or country other than the United States accounted for more than 10% of revenue for fiscal years 2023, 2022, or 2021. Revenue, classified by the major geographic areas in which our customers were located, was as follows:
| (In millions) |
|
|
|
|
|
| Year Ended June 30, |
2023 |
|
2022 |
|
2021 |
| United States (a) |
$ 106,744 |
|
$ 100,218 |
|
$ 83,953 |
| Other countries |
105,171 |
|
98,052 |
|
84,135 |
| Total |
$ 211,915 |
|
$ 198,270 |
|
$ 168,088 |
- Includes billings to OEMs and certain multinational organizations because of the nature of these businesses and the impracticability of determining the geographic source of the revenue.
Revenue, classified by significant product and service offerings, was as follows:
| (In millions) |
|
|
|
|
|
| Year Ended June 30, |
2023 |
|
2022 |
|
2021 |
| Server products and cloud services |
$ 79,970 |
|
$ 67,350 |
|
$ 52,589 |
| Office products and cloud services |
48,728 |
|
44,862 |
|
39,872 |
| Windows |
21,507 |
|
24,732 |
|
22,488 |
| Gaming |
15,466 |
|
16,230 |
|
15,370 |
| LinkedIn |
15,145 |
|
13,816 |
|
10,289 |
| Search and news advertising |
12,208 |
|
11,591 |
|
9,267 |
| Enterprise Services |
7,722 |
|
7,407 |
|
6,943 |
| Devices |
5,521 |
|
7,306 |
|
7,143 |
| Dynamics |
5,437 |
|
4,687 |
|
3,754 |
| Other |
211 |
|
289 |
|
373 |
| Total |
$ 211,915 |
|
$ 198,270 |
|
$ 168,088 |
Our Microsoft Cloud revenue, which includes Azure and other cloud services, Office 365 Commercial, the commercial portion of LinkedIn, Dynamics 365, and other commercial cloud properties, was $111.6 billion, $91.4 billion, and $69.1 billion in fiscal years 2023, 2022, and 2021, respectively. These amounts are primarily included in Server products and cloud services, Office products and cloud services, LinkedIn, and Dynamics in the table above.
Assets are not allocated to segments for internal reporting presentations. A portion of amortization and depreciation is included with various other costs in an overhead allocation to each segment. It is impracticable for us to separately identify the amount of amortization and depreciation by segment that is included in the measure of segment profit or loss.
Long-lived assets, excluding financial instruments and tax assets, classified by the location of the controlling statutory company and with countries over 10% of the total shown separately, were as follows:
| (In millions) |
|
|
|
|
|
| June 30, |
2023 |
|
2022 |
|
2021 |
| United States |
$ 114,380 |
|
$ 106,430 |
|
$ 76,153 |
| Ireland |
16,359 |
|
15,505 |
|
13,303 |
| Other countries |
56,500 |
|
44,433 |
|
38,858 |
| Total |
$ 187,239 |
|
$ 166,368 |
|
$ 128,314 |
Auditor's Report
REPORT OF INDEPENDENT REGISTERED PUBLIC ACCOUNTING FIRM
To the Stockholders and the Board of Directors of Microsoft Corporation
Opinion on the Financial Statements
We have audited the accompanying consolidated balance sheets of Microsoft Corporation and subsidiaries (the “Company”) as of June 30, 2023 and 2022, the related consolidated statements of income, comprehensive income, cash flows, and stockholders’ equity, for each of the three years in the period ended June 30, 2023, and the related notes (collectively referred to as the “financial statements”). In our opinion, the financial statements present fairly, in all material respects, the financial position of the Company as of June 30, 2023 and 2022, and the results of its operations and its cash flows for each of the three years in the period ended June 30, 2023, in conformity with accounting principles generally accepted in the United States of America.
We have also audited, in accordance with the standards of the Public Company Accounting Oversight Board (United States) (PCAOB), the Company’s internal control over financial reporting as of June 30, 2023, based on criteria established in Internal Control — Integrated Framework (2013) issued by the Committee of Sponsoring Organizations of the Treadway Commission and our report dated July 27, 2023, expressed an unqualified opinion on the Company’s internal control over financial reporting.
Basis for Opinion
These financial statements are the responsibility of the Company’s management. Our responsibility is to express an opinion on the Company’s financial statements based on our audits. We are a public accounting firm registered with the PCAOB and are required to be independent with respect to the Company in accordance with the U.S. federal securities laws and the applicable rules and regulations of the Securities and Exchange Commission and the PCAOB.
We conducted our audits in accordance with the standards of the PCAOB. Those standards require that we plan and perform the audit to obtain reasonable assurance about whether the financial statements are free of material misstatement, whether due to error or fraud. Our audits included performing procedures to assess the risks of material misstatement of the financial statements, whether due to error or fraud, and performing procedures that respond to those risks. Such procedures included examining, on a test basis, evidence regarding the amounts and disclosures in the financial statements. Our audits also included evaluating the accounting principles used and significant estimates made by management, as well as evaluating the overall presentation of the financial statements. We believe that our audits provide a reasonable basis for our opinion.
Critical Audit Matters
The critical audit matters communicated below are matters arising from the current-period audit of the financial statements that were communicated or required to be communicated to the audit committee and that (1) relate to accounts or disclosures that are material to the financial statements and (2) involved our especially challenging, subjective, or complex judgments. The communication of critical audit matters does not alter in any way our opinion on the financial statements, taken as a whole, and we are not, by communicating the critical audit matters below, providing separate opinions on the critical audit matters or on the accounts or disclosures to which they relate.
Revenue Recognition – Refer to Note 1 to the financial statements
Critical Audit Matter Description
The Company recognizes revenue upon transfer of control of promised products or services to customers in an amount that reflects the consideration the Company expects to receive in exchange for those products or services. The Company offers customers the ability to acquire multiple licenses of software products and services, including cloud-based services, in its customer agreements through its volume licensing programs.
Significant judgment is exercised by the Company in determining revenue recognition for these customer agreements, and includes the following:
- Determination of whether products and services are considered distinct performance obligations that should be accounted for separately versus together, such as software licenses and related services that are sold with cloud-based services.
- The pattern of delivery (i.e., timing of when revenue is recognized) for each distinct performance obligation.
- Identification and treatment of contract terms that may impact the timing and amount of revenue recognized (e.g., variable consideration, optional purchases, and free services).
- Determination of stand-alone selling prices for each distinct performance obligation and for products and services that are not sold separately.
Given these factors and due to the volume of transactions, the related audit effort in evaluating management’s judgments in determining revenue recognition for these customer agreements was extensive and required a high degree of auditor judgment.
How the Critical Audit Matter Was Addressed in the Audit
Our principal audit procedures related to the Company’s revenue recognition for these customer agreements included the following:
- We tested the effectiveness of controls related to the identification of distinct performance obligations, the determination of the timing of revenue recognition, and the estimation of variable consideration.
- We evaluated management’s significant accounting policies related to these customer agreements for reasonableness.
- We selected a sample of customer agreements and performed the following procedures:
- Obtained and read contract source documents for each selection, including master agreements, and other documents that were part of the agreement.
- Tested management’s identification and treatment of contract terms.
- Assessed the terms in the customer agreement and evaluated the appropriateness of management’s application of their accounting policies, along with their use of estimates, in the determination of revenue recognition conclusions.
- We evaluated the reasonableness of management’s estimate of stand-alone selling prices for products and services that are not sold separately.
- We tested the mathematical accuracy of management’s calculations of revenue and the associated timing of revenue recognized in the financial statements.
Income Taxes – Uncertain Tax Positions – Refer to Note 12 to the financial statements
Critical Audit Matter Description
The Company’s long-term income taxes liability includes uncertain tax positions related to transfer pricing issues that remain unresolved with the Internal Revenue Service (“IRS”). The Company remains under IRS audit, or subject to IRS audit, for tax years subsequent to 2003. While the Company has settled a portion of the IRS audits, resolution of the remaining matters could have a material impact on the Company’s financial statements.
Conclusions on recognizing and measuring uncertain tax positions involve significant estimates and management judgment and include complex considerations of the Internal Revenue Code, related regulations, tax case laws, and prior-year audit settlements. Given the complexity and the subjective nature of the transfer pricing issues that remain unresolved with the IRS, evaluating management’s estimates relating to their determination of uncertain tax positions required extensive audit effort and a high degree of auditor judgment, including involvement of our tax specialists.
How the Critical Audit Matter Was Addressed in the Audit
Our principal audit procedures to evaluate management’s estimates of uncertain tax positions related to unresolved transfer pricing issues included the following:
- We evaluated the appropriateness and consistency of management’s methods and assumptions used in the identification, recognition, measurement, and disclosure of uncertain tax positions, which included testing the effectiveness of the related internal controls.
- We read and evaluated management’s documentation, including relevant accounting policies and information obtained by management from outside tax specialists, that detailed the basis of the uncertain tax positions.
- We tested the reasonableness of management’s judgments regarding the future resolution of the uncertain tax positions, including an evaluation of the technical merits of the uncertain tax positions.
- For those uncertain tax positions that had not been effectively settled, we evaluated whether management had appropriately considered new information that could significantly change the recognition, measurement or disclosure of the uncertain tax positions.
- We evaluated the reasonableness of management’s estimates by considering how tax law, including statutes, regulations and case law, impacted management’s judgments.
/s/ DELOITTE & TOUCHE LLP
Seattle, Washington
July 27, 2023
We have served as the Company’s auditor since 1983.
Controls & Procedures
CHANGES IN AND DISAGREEMENTS WITH ACCOUNTANTS ON ACCOUNTING AND FINANCIAL DISCLOSURE
Not applicable.
CONTROLS AND PROCEDURES
Under the supervision and with the participation of our management, including the Chief Executive Officer and Chief Financial Officer, we have evaluated the effectiveness of our disclosure controls and procedures as required by Exchange Act Rule 13a-15(b) as of the end of the period covered by this report. Based on that evaluation, the Chief Executive Officer and Chief Financial Officer have concluded that these disclosure controls and procedures are effective.
REPORT OF MANAGEMENT ON INTERNAL CONTROL OVER FINANCIAL REPORTING
Our management is responsible for establishing and maintaining adequate internal control over financial reporting for the Company. Internal control over financial reporting is a process to provide reasonable assurance regarding the reliability of our financial reporting for external purposes in accordance with accounting principles generally accepted in the United States of America. Internal control over financial reporting includes maintaining records that in reasonable detail accurately and fairly reflect our transactions; providing reasonable assurance that transactions are recorded as necessary for preparation of our consolidated financial statements; providing reasonable assurance that receipts and expenditures of company assets are made in accordance with management authorization; and providing reasonable assurance that unauthorized acquisition, use, or disposition of company assets that could have a material effect on our consolidated financial statements would be prevented or detected on a timely basis. Because of its inherent limitations, internal control over financial reporting is not intended to provide absolute assurance that a misstatement of our consolidated financial statements would be prevented or detected.
Management conducted an evaluation of the effectiveness of our internal control over financial reporting based on the framework in Internal Control – Integrated Framework (2013) issued by the Committee of Sponsoring Organizations of the Treadway Commission. Based on this evaluation, management concluded that the Company’s internal control over financial reporting was effective as of June 30, 2023. There were no changes in our internal control over financial reporting during the quarter ended June 30, 2023 that have materially affected, or are reasonably likely to materially affect, our internal control over financial reporting. Deloitte & Touche LLP has audited our internal control over financial reporting as of June 30, 2023; their report follows.
REPORT OF INDEPENDENT REGISTERED PUBLIC ACCOUNTING FIRM
To the Stockholders and the Board of Directors of Microsoft Corporation
Opinion on Internal Control over Financial Reporting
We have audited the internal control over financial reporting of Microsoft Corporation and subsidiaries (the “Company”) as of June 30, 2023, based on criteria established in Internal Control — Integrated Framework (2013) issued by the Committee of Sponsoring Organizations of the Treadway Commission (COSO). In our opinion, the Company maintained, in all material respects, effective internal control over financial reporting as of June 30, 2023, based on criteria established in Internal Control — Integrated Framework (2013) issued by COSO.
We have also audited, in accordance with the standards of the Public Company Accounting Oversight Board (United States) (PCAOB), the consolidated financial statements as of and for the year ended June 30, 2023, of the Company and our report dated July 27, 2023, expressed an unqualified opinion on those financial statements.
Basis for Opinion
The Company’s management is responsible for maintaining effective internal control over financial reporting and for its assessment of the effectiveness of internal control over financial reporting, included in the accompanying Report of Management on Internal Control over Financial Reporting. Our responsibility is to express an opinion on the Company’s internal control over financial reporting based on our audit. We are a public accounting firm registered with the PCAOB and are required to be independent with respect to the Company in accordance with the U.S. federal securities laws and the applicable rules and regulations of the Securities and Exchange Commission and the PCAOB.
We conducted our audit in accordance with the standards of the PCAOB. Those standards require that we plan and perform the audit to obtain reasonable assurance about whether effective internal control over financial reporting was maintained in all material respects. Our audit included obtaining an understanding of internal control over financial reporting, assessing the risk that a material weakness exists, testing and evaluating the design and operating effectiveness of internal control based on the assessed risk, and performing such other procedures as we considered necessary in the circumstances. We believe that our audit provides a reasonable basis for our opinion.
Definition and Limitations of Internal Control over Financial Reporting
A company’s internal control over financial reporting is a process designed to provide reasonable assurance regarding the reliability of financial reporting and the preparation of financial statements for external purposes in accordance with generally accepted accounting principles. A company’s internal control over financial reporting includes those policies and procedures that (1) pertain to the maintenance of records that, in reasonable detail, accurately and fairly reflect the transactions and dispositions of the assets of the company; (2) provide reasonable assurance that transactions are recorded as necessary to permit preparation of financial statements in accordance with generally accepted accounting principles, and that receipts and expenditures of the company are being made only in accordance with authorizations of management and directors of the company; and (3) provide reasonable assurance regarding prevention or timely detection of unauthorized acquisition, use, or disposition of the company’s assets that could have a material effect on the financial statements.
Because of its inherent limitations, internal control over financial reporting may not prevent or detect misstatements. Also, projections of any evaluation of effectiveness to future periods are subject to the risk that controls may become inadequate because of changes in conditions, or that the degree of compliance with the policies or procedures may deteriorate.
/s/ DELOITTE & TOUCHE LLP
Seattle, Washington
July 27, 2023