

Text-to-Viz
DO YOU KNOW
 |
People remember 80% of what they see, only 20% of what they read |
 |
An infographic is 30x more likely to be read than pure text |
 |
People are 17% more likely to be persuaded by imagery content |
PROJECT DESCRIPTION
Information graphics (infographics) can effectively deliver messages in an engaging and memorable fashion. Hence, they have now gained tremendous popularity in presentations, documents, dashboards, etc. However, as a task usually requiring high-level design creativity and good proficiency with graphic design tools, authoring a professional infographic remains a challenge for information workers. We proposed Text-to-Vis to lower the access barrier for them, as well as to unleash and inspire their creativity. With natural language statements as input, Text-to-Vis can automatically generate a diverse set of infographics that can well convey the information in the text. Text-to-Vis allows information workers to achieve expressive and compelling infographics effortlessly, and use them to enhance and enrich their presentations and documents.
APPROACH
STATEMENT |
TECHNOLOGY |
INFOGRAPHICS |
||
“More than 20% of smartphone users are social network users” |
 |
Natural language analysisVisualization synthesis |
|
 |
EXAMPLES
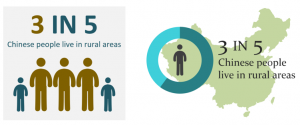
3 in 5 Chinese people live in rural areas
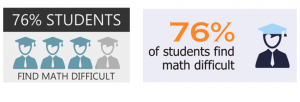
76% of students find math difficult
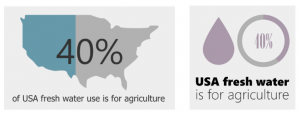
40% of USA fresh water use is for agriculture
人员
Weiwei Cui
Researcher
Ray Huang
Research SDE
Yun Wang
Senior Researcher
Lei Fang
Senior Researcher
Haidong Zhang
Principal Architect
Dongmei Zhang
Distinguished Scientist, Deputy Managing Director, Microsoft Research Asia