Driving accountability with advanced forecasting in Dynamics 365 Sales
Today we’re announcing new Dynamics 365 Sales forecasting capabilities are now available for general use. Over the last year, we’ve worked closely with many of you and many customers to better understand your sales scenarios and unique business requirements. Thank you for your partnership in helping us improve and enhance this service.
A sales forecast is a projection of what your sales team will close at the end of a given period. When done correctly, it can play a significant role in your company’s success. Managers can track individual sales performance against quotas to proactively provide coaching. Directors can use the forecast trends to anticipate departmental sales and reallocate resources and company leaders can use those forward-looking numbers to change the product strategy or convey updated projections to investors.
Bottoms-up sales forecasting has historically been complex to implement. In fact, although customer relationship management systems (CRMs) have been broadly adopted across industries, many organizations still use non-scalable technologies like spreadsheets to manage and coordinate their forecasts. These error-prone and tedious methods are still preferable to some because they provide a level of control and flexibility that isn’t found in any of the alternatives.
The new forecast capabilities for Dynamics 365 Sales aims to change this. In this latest release, organizations will be able to model their sales process in an intuitive experience, allowing them to identify the performance metrics that matter most and visualize them across reporting and territory hierarchies. Sellers and managers will be able to effectively keep track of their progress, easily manage their pipeline to update their numbers, and make adjustments as needed. Using AI-driven models, organizations will also be able to take the guess work out of forecasting and help sellers and managers with their projections.
Let’s look at how these new forecasting capabilities allow you to model your bottoms-up forecasting process and drive accountability and predictability across your organization.
Choosing your hierarchy

The first thing you need to understand about forecasting is that organizations have varying implementations of sales processes. One organization prefers to forecast using the direct report hierarchy while another may use a territory model. In this release, Dynamics 365 supports both user-based and territory-based forecast hierarchies, allowing you to configure the forecast according to your unique business structure. All you have to do is model the hierarchy in Dynamics and then select the top of the hierarchy.
Configuring who can view the forecast

Not everyone in the organization should be able to see the full forecast. This is why it’s important to configure the security needs of the forecast. Using a combination of entity-based and role-based security, you can fine tune the security requirements of your forecast data. For example, you can open the full forecast to all sales excellence users by adding the sales excellence security role to the security construct.
Customizing the forecast layout

Although many organizations follow a common methodology of requiring their sales people to forecast best, most likely, and worst case (BMW) revenue, there are variations of this approach across industries, products, and geographies. The native forecast capabilities provide a flexible configuration to support multiple different types of rollup categories and measures.
The first thing you need to do is select the option set that will define the confidence level of opportunities. For example, if you use the out-of-the-box (OOTB) forecast category option set of the opportunity, you will be able to create rollups of all opportunities that are of value won. You have the ability to choose any option set that meets your requirements, and then configure the rollup columns accordingly. You will also need to ensure to select the appropriate date and amount fields for each columns so that the rollup knows which records to include and what amount to sum. Every column can be shown or hidden, and it can even be compared to the quota column.
Once you’ve identified the rollup columns, you can create additional calculated columns, simple columns, or hierarchy-related columns.
- Calculated columns allow you to combine multiple columns into one, allowing you to create a gap to quota column so your sellers quickly know how far they are from quota or a pipeline coverage column so you know if your sellers have enough deals in the pipeline to cover that gap.
- Simple columns allow you to create a column where you control the data, for example the quota column. You may create additional simple columns to track target exceed or even upload relevant data from another system. You can find more details on this in the next section.
- Finally, hierarchy-related columns allow you to pull information from the hierarchy that may be relevant to the forecast. For example, if a territory’s forecast manager is required, the data can be pulled in.
Additional filtering to only include the deals that matter

Sometimes you may want to filter the opportunities to include in the forecast. Say you want to only create a forecast for opportunities that are tagged to enterprise customers. In the filter area, you’re able to add an extra query that will be used to limit the opportunities used in the forecast. The whole forecast will only reflect opportunities that match the query.
Managing quotas for success

To gauge performance, you need to define what a measure of success looks like. Quotas or targets allow you to do just that. Out-of-the-box, a quota column is made available, however, should you require to add another column, for instance, to track your stretch target, you’re able to do so by creating simple columns.
Once enabled, you have the ability to easily add your quota to your whole team. Use the downloadable Excel schedule template to bulk add all quotas and simple data for every team member.
Activating the forecast to make it available

Finally, to make the forecast available, you will need to activate the forecast once everything is configured according to your business needs.
Now that the forecast is configured and published, let’s see how sellers and managers interact with it.
Viewing the forecast

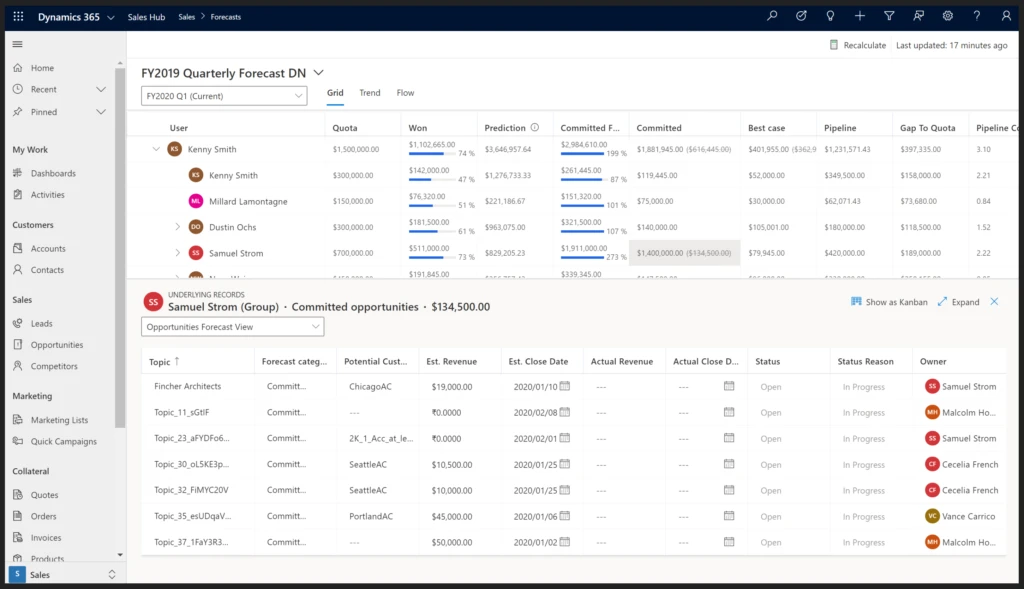
The forecast is available to sellers and managers in a new forecast area. Your team will see a new forecast grid that depending on your security profile, will show all the different forecast category rollups spread across the different measures. For example, as a manager, you’ll be able to drill down to your sellers to see how they are performing and how each of their forecasts is contributing to yours. The forecast will also include both the quota and prediction columns allowing sellers and managers to easily benchmark their performance against these values.
A forecast is a reflection of a seller’s pipeline

A big part of forecasting is pipeline management. Knowing what is in your pipeline and being able to adjust it accordingly ensures the most accurate forecast. Although it will still be possible to view all underlying deals in a grid for quick edits, we’ve added a kanban experience that is much more visual and will allow sellers to quickly and easily move deals between forecast stages while at the same time seeing how these changes impact their forecast.
Making adjustments

Because most forecasting methods depend on intuition and subjectivity, managers may have more information that allows them to accurately estimate their sellers’ numbers. In the forecast configuration, every column can be marked as adjustable. Once that’s done, a manager is then able to add their own judgement, in essence overwriting the forecast values to better represent their estimation. The adjustments are stored and propagated across the forecast to ensure proper accountability.
AI-driven forecast with predictive forecasting

If you’d like to supplement the subjective projections of your team with objective predictions, you can enable predictive forecasting. The prediction column uses an AI-model that takes into account data and signals from the current sales pipeline and the historical performance to predict opportunity revenue for each seller within your hierarchy. Once enabled, a new prediction column will appear in the forecast allowing sellers and managers to better understand their pipeline and the factors that impact the prediction.
Please note Dynamics 365 Sales Insights is required to enable predictive forecasting.
Tracking changes in the pipeline with snapshots and deal flow visualization

A forecast is a living process where sellers and managers actively overview, update, and submit their projections. Because of the dynamic nature of the process, as a sales organization, you need to keep tabs on the changes that impact the forecast, especially when the forecast is used to make strategic decisions. With snapshotting, you can freeze the forecast data at a moment in time, allowing you to go back in time and drive accountability for the changes. The deal flow visualization provides a visual way of identifying how the pipeline has changed between snapshots, allowing managers to drill into the exact deals that have contributed to the increase or decrease in forecast commitment. Thus, managers can follow-up with their teams and coach them to improve their forecast accuracy.
Please note Dynamics 365 Sales Insights is required to enable snapshots and deal flow analysis.
A native forecast experience for both simple and mature organizations
Although forecasting is done by every organization, its implementation has historically been complex. These new forecasting capabilities in Dynamics 365 Sales are native, intuitive, and flexible and will enable your organization to drive more accountability and predictability in your sales process, and in the end, drive more sales.
We encourage you to try the new sales forecasting capabilities directly in the Sales Hub application and provide feedback at d365forecastingfeedback@microsoft.com
To learn more about sales forecasts, read our recent post.