Collaborate and debug an app together in real-time with Monitor
I’m excited to announce that we’re rolling out a new feature in the Monitor that enables app makers to collaborate and debug an app together in real-time.
“Click the button in the top right, no, not that button, the other one. OK, now select the second row and the + icon on the right…let me take control!” – yes, we’ve all experienced this at some time, trying to walk a teammate through the exact steps to reproduce an issue. We typically end up doing screen shares and passing control back-and-forth until the issue is reproduced and the right data is captured. It would be easier to reproduce the issue yourself and for everyone to view the same event logs in real-time together, and this is where the new Invite feature in monitor can help.
With the Invite feature, you can ask your teammates to participate in your Monitor debug session. They do not have to open the app or reproduce the specific scenario you are debugging. You can reproduce the issue in the app and then your teammates will see the exact same app events in their own monitor browser window in real-time. You can then collaboratively work together, inspecting different sections of the log without stepping on each other, and cut-down the time to find the problem.
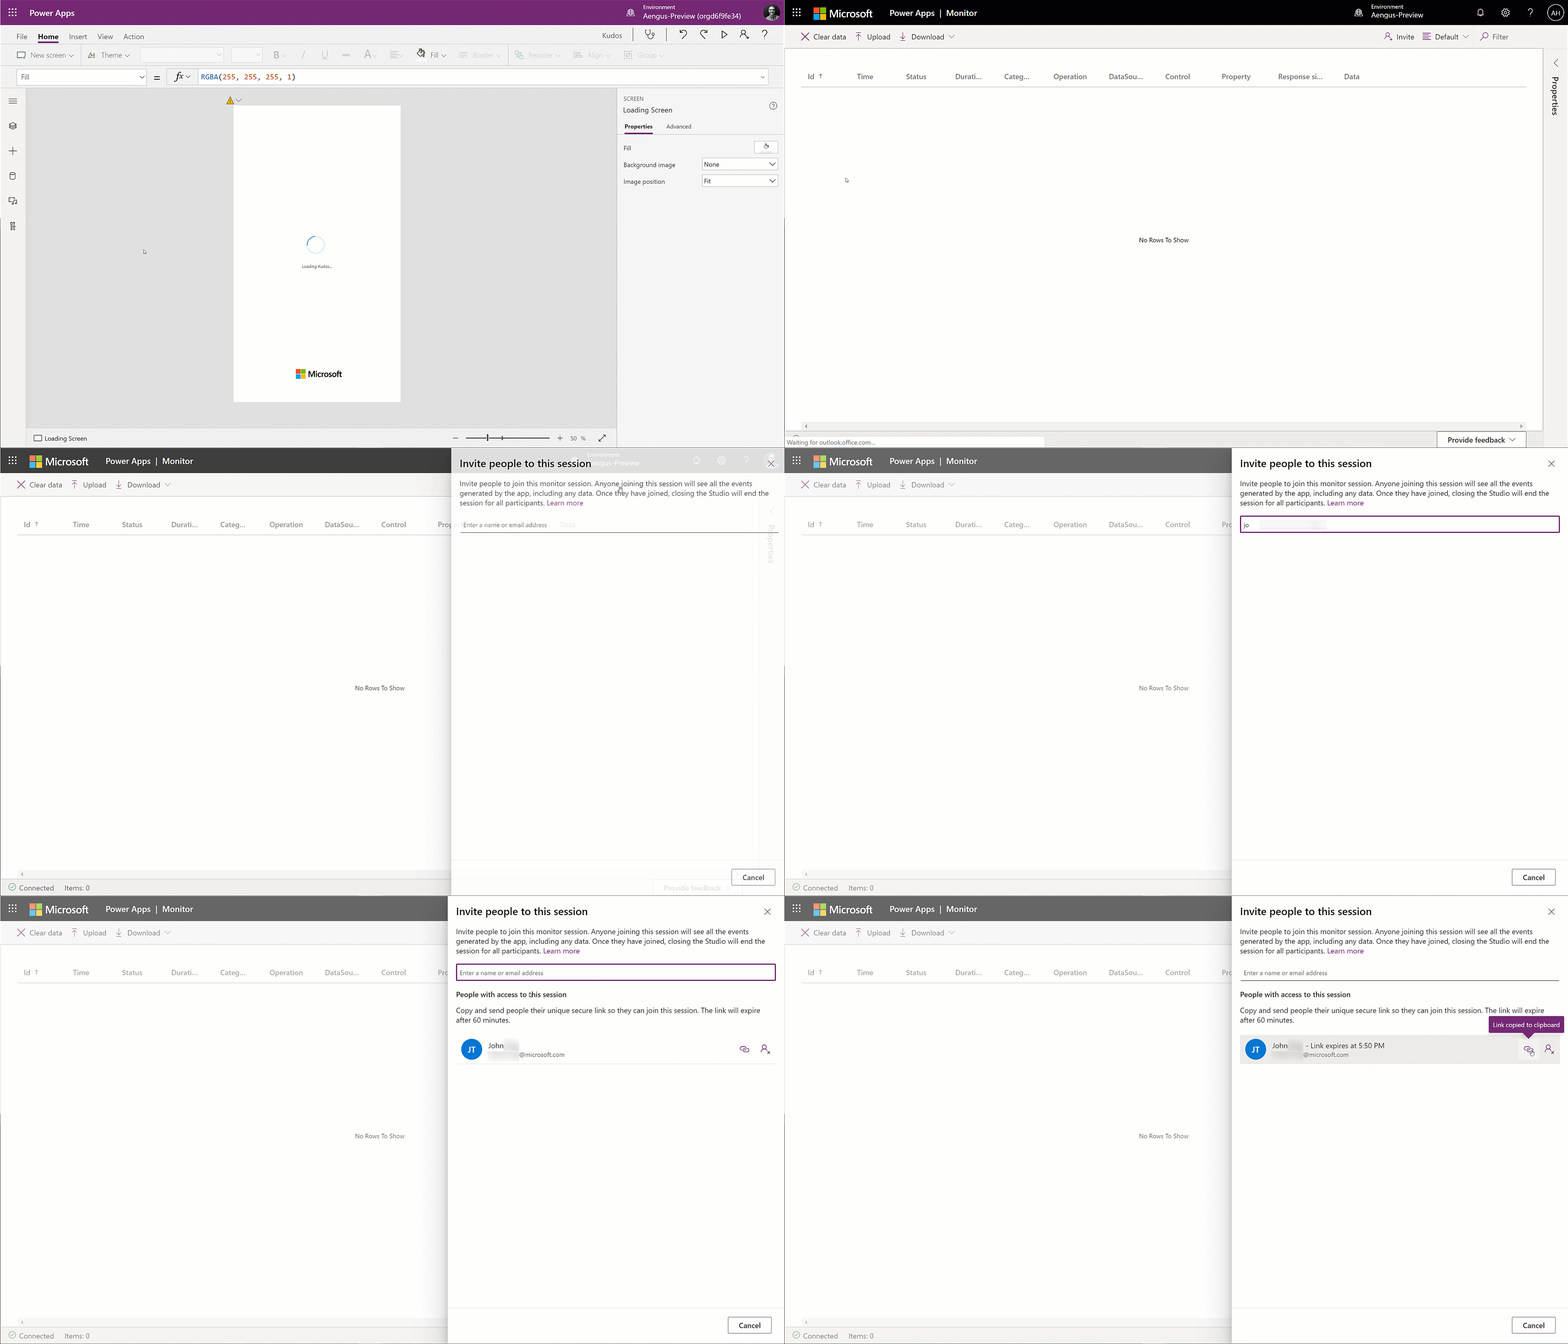
To invite your teammates, or anyone in your organization, start a monitor session from the Canvas studio advanced tools panel. Select Invite in the in the Monitor and enter the name or alias of the user(s) who you want to collaborate with. Copy and send the link to your teammate. When your teammate opens the link, it will connect them directly to your monitor session, and they will see the events and data generated from your app in real-time in their own browser window.

Note, the link is unique to the invited user and it cannot be shared with others. The link is valid for 60 minutes.
What else is new?
We’ve recently added other improvements to the Monitor such as extending the events shown to include custom traces and debug statements as well as user actions taken in your app. We’ve also color-coded expressions to make it easier to map your events in the formula panel. The download/upload feature allows you to archive or share the event logs with your teammates. This can also help support teams review your issues faster so consider providing a log file if you are raising a support ticket.
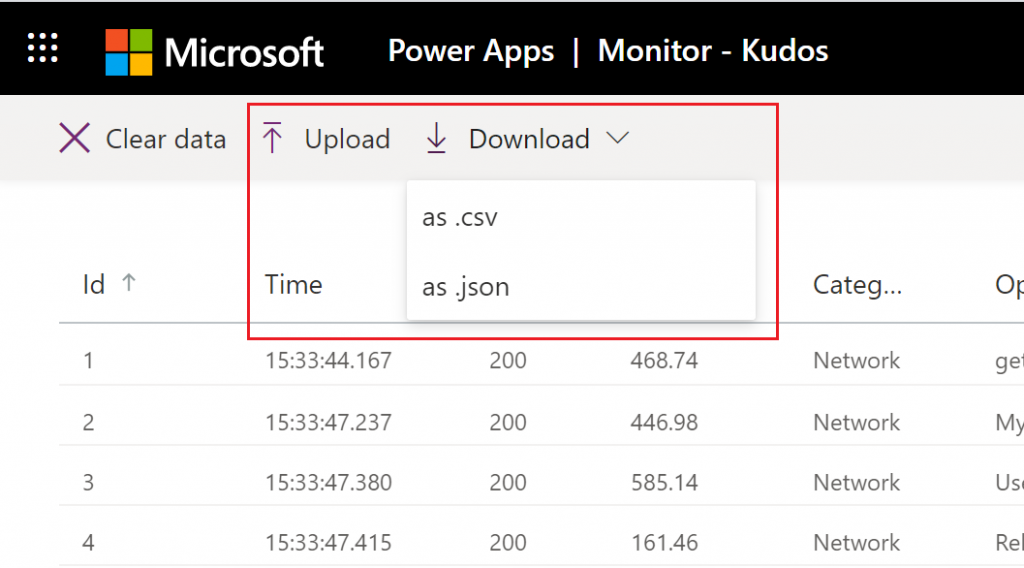
Upload/Download event logs
You can download the event logs that are shown in the table for offline analysis and troubleshooting issues later. The downloaded trace file can be exported as a .json or excel file and shared with others so they can help you solve your problem. Excel files are download only, but if you export the events in json format, these can be uploaded back into the monitor to help analyze the details offline. If you are escalating a problem, you can also attach the json log file to your support service request, and this could help expedite the solution to your problem.

Add custom debug statements
Using the Trace function, you can now write your own messages and debug statements at various points in your app and have them displayed in the monitor log. You can write messages and output variable values or a record in the trace expression.
For example, say you are interested in the value of a variable called NumKudosToShow. You could Trace this value to the monitor using the below expression in your app.
// Trace values to monitor
Trace(“Debug: value of NumKudosToShow is ” & NumKudosToShow);
Alternatively, you could Trace multiple values at once using the below expression.
Trace(“Debug values: Screen – ” & screenName, TraceSeverity.Information, {dashboardKudosCount: CountRows(dashboardKudos), NumKudosToShowValue:NumKudosToShow});
The output of the trace can be viewed in the Details tab in the properties panel.

User Actions
Even if an action on your app does not result in a network call, you will be able to understand what operations are taken such as clicking a button on a screen, or typing text into an input box.
Expression mapping
In a large formula, it was difficult to identify the expression which mapped to the event you were viewing. It took a bit of scrolling up and down or using the search and find option to get it. We’ve now made this a lot easier to find by highlighting the specific expression in the formula which caused the related event. In the example below, the expression related to a getRows operation is highlighted in the formula, allowing us to quickly identify the formula for the event.

What’s next?
We have some more exciting new features planned and we will be rolling these out soon – debugging the published app, debugging a specific end users app session, new screen load performance events and delegation warnings as well as tracing for Model driven apps. We’d love to hear your feedback on the new invite feature and improvements. Let us know how you are using the monitor and what additional information would you want to see that would help you debug and improve your apps? Please provide your feedback below, or directly in the tool which links to our community forum post.


