Improve monitoring of Dataverse plugins using Application insights
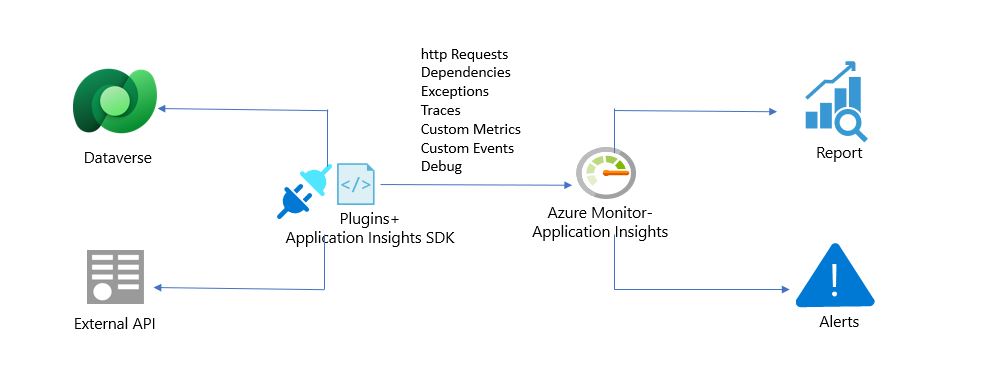
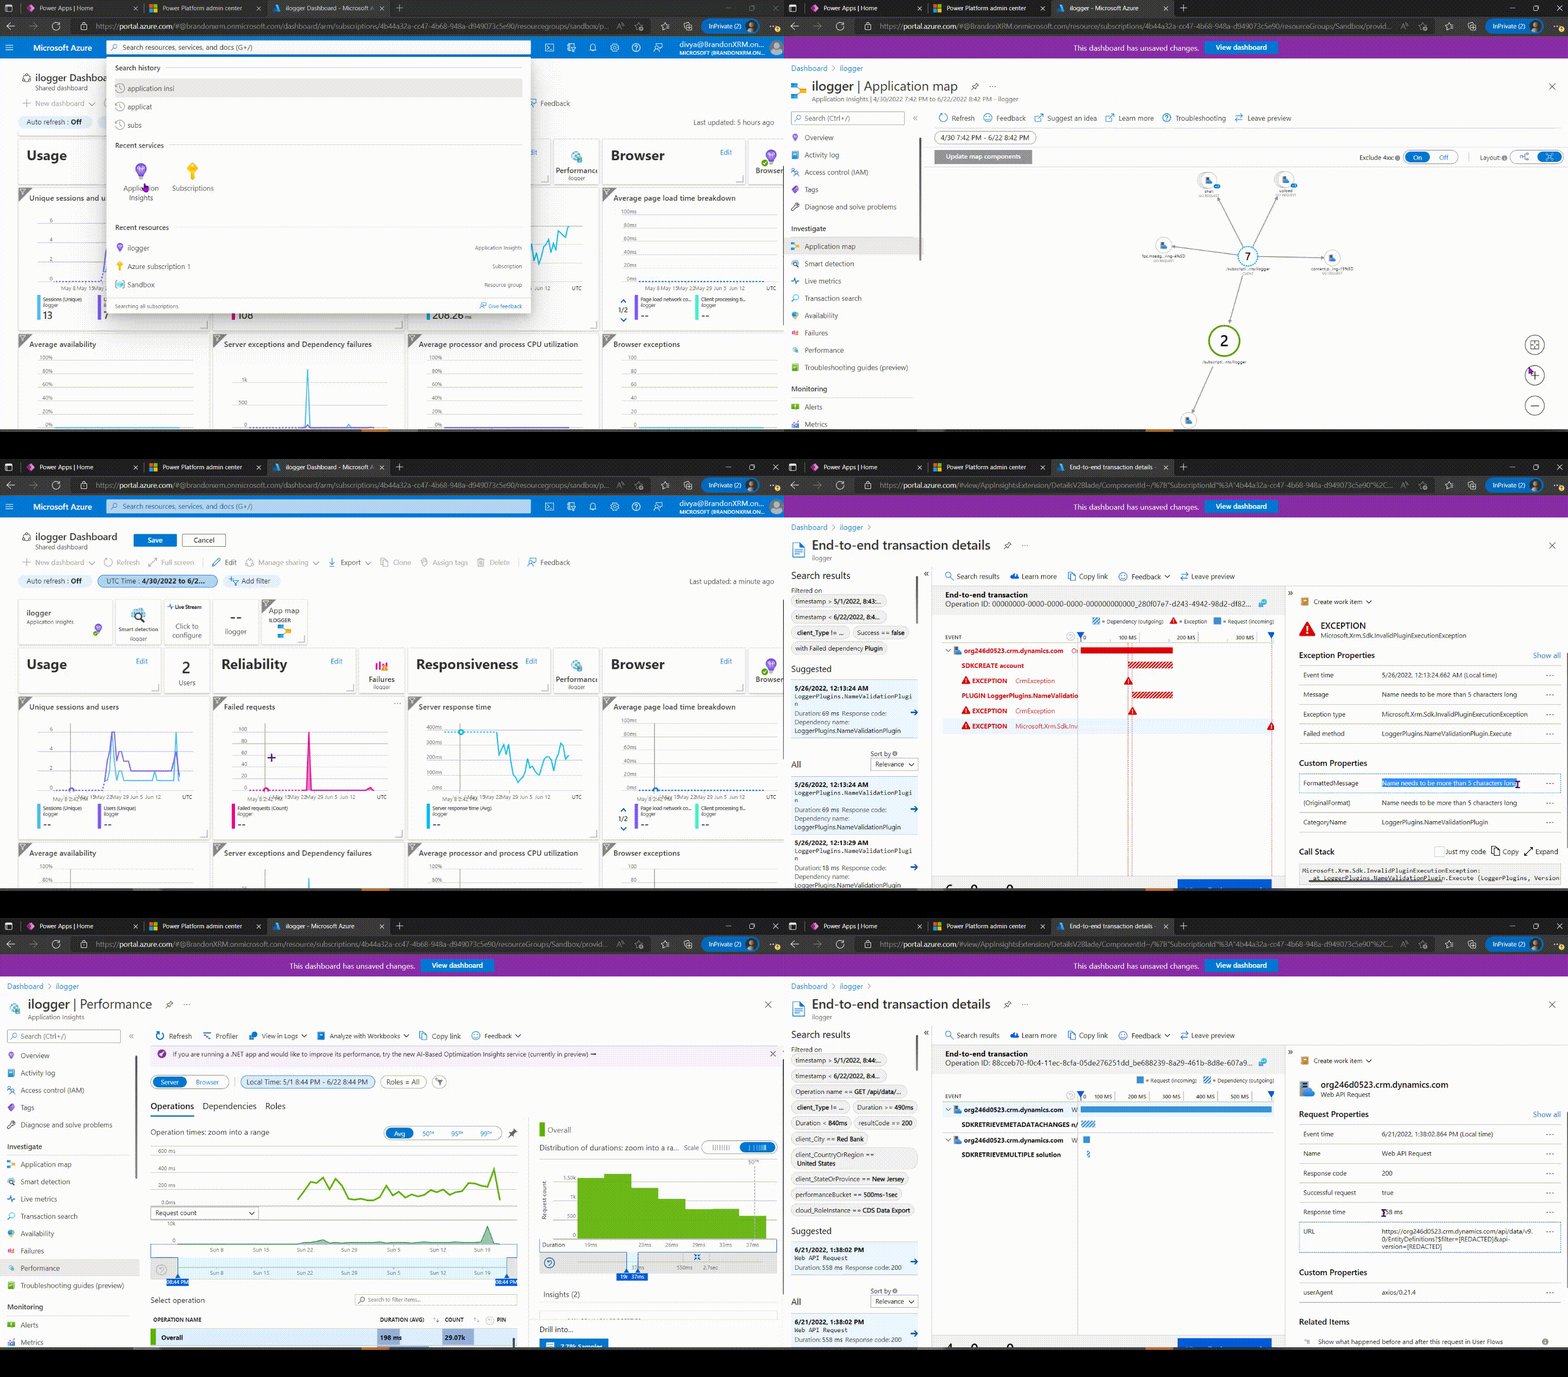
We are excited to announce that Application insights is now Generally Available for Dataverse plugins. We learnt from our customers how important it is to have monitoring available out-of-the-box and to easily get started with samples and recommendations including effective alerts, optimal queries, and customizable reports. To ensure that you can monitor your production workloads anywhere in a trustworthy manner, we have enabled state-of-art monitoring solution built on the Azure Monitor ecosystem designed to help prodevs to diagnose plugin timeouts, create custom alerts and reports, monitor global usage, and automatically detect patterns and anomalies in the telemetry data using the built-in Smart Detection feature, thus helping you to keep it always available, reliable and performant.

3 easy steps:
Get Started Today!
For more in-depth look, you can learn more about monitoring best practices here:
Steps to enable plugin telemetry
We welcome you to reach out to us with any questions or feedback on our Power Apps Ideas

