Collect Dynamics 365 for Finance and Operations event traces with Windows Performance Monitor
Just as with AX 2012, users can collect Dynamics 365 for Finance and Operations event traces using Windows Performance Monitor. Other options are explained here:
https://docs.microsoft.com/en-us/en-us/dynamics-365/blog/unified-operations/dev-itpro/perf-test/trace-trace-tutorial (web version)
https://docs.microsoft.com/en-us/en-us/dynamics-365/blog/unified-operations/dev-itpro/perf-test/trace-parser (desktop version)
Windows Performance Monitor can be used in non-production where the Dynamics 365 for Finance and Operations client tracing is not possible. For example, WMS Mobile Device scenarios, or longer processes such as data imports, where the 1GB file size limit would be exceeded using the web client.
Note that a lot of the steps are similar to the previous AX 2012 post by Sam Peng, therefore I have deliberately kept the same format. The only differences here are we change the event trace providers and increase the buffer sizes based on testing I’ve done with the help of a few engineers and customers. You may need to increase or decrease those depending on your scenario, although it should fit most scenarios.
Steps to collect Dynamics 365 for Finance and Operations event traces with Windows Performance Monitor:
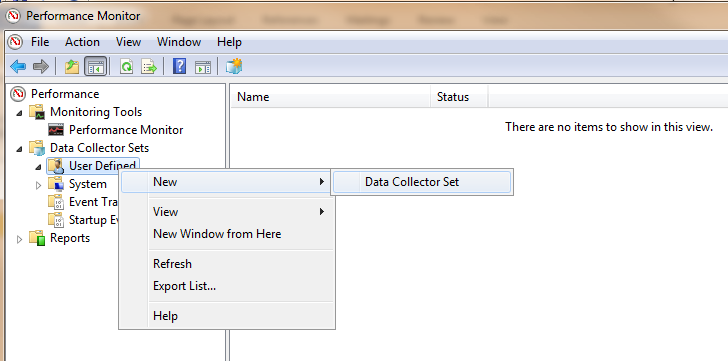
1. On a box that runs the AOS instance you want to collect event traces from, start Windows Performance Monitor and add a new User Defined Data Collector Set:
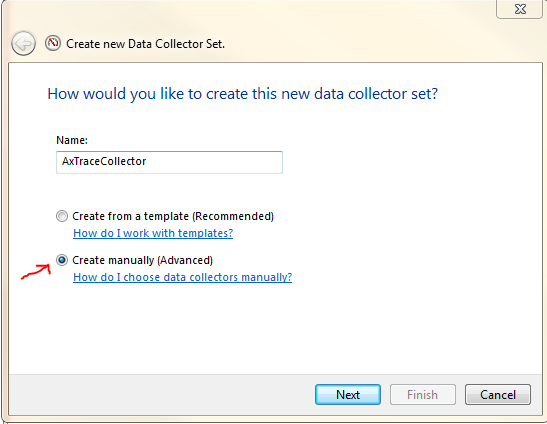
2. Give the Data Collector Set a name and select [Create manually] (you will be able to use “Create from a template” once you have a template created after going through the manual steps); click [Next].
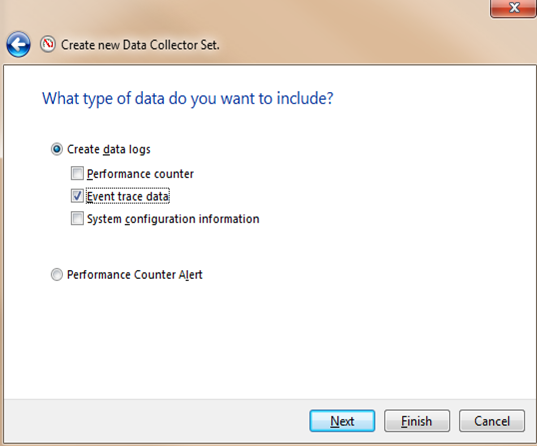
3. Check [Event Trace Data] under [Create Data Logs], and then click the [Next] button.
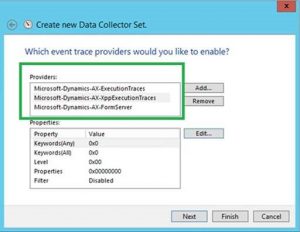
4. In the step “Which Event Trace Provider would you like to enable”, click the [Add] button and select the following from the Event Trace Provider list, then click [OK].
Microsoft-Dynamics-AX-ExecutionTraces
Microsoft-Dynamics-AX-XppExecutionTraces
Microsoft-Dynamics-AX-FormServer
5. Click [Next] and specify a directory for storing trace files.
6. In the next step, select [Save and close] and then click the [Finish] button.
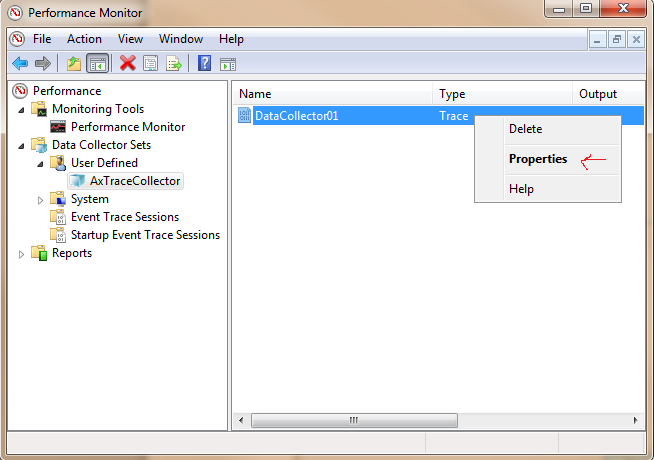
7. Now you need to modify some settings for the newly created data collector. Right click the “DataCollector01” in the right pane, and then click the [Properties] menu item:
In the Properties window, switch to the [Trace Buffers] tab and modify the default buffer settings. The default buffer setting does not work well for collecting AX event traces where large amount of events could be generated in short time and fill the buffers quickly. We recommend the following settings (leave the rest setting as default):
Buffer Size: 512kB
Minimum Buffers: 120
Maximum Buffers: 120
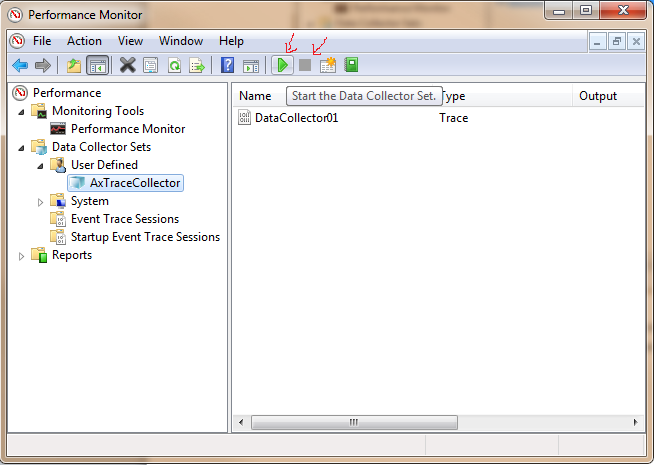
8. Now you can start or stop collecting AX event traces by clicking the start/stop buttons on the tool bar:
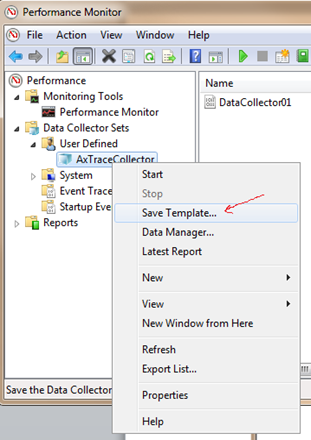
9. You may want to save the data collector set as a template and reuse the template on a different box, or share it with other users: Right click the Data Collector Sets and select [Save Template] menu item:
10. To keep file sizes smaller and more manageable for longer periods of tracing:
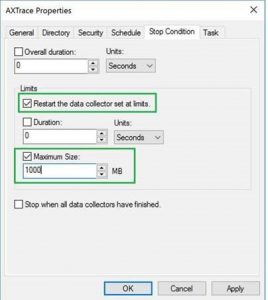
You can then set the data collector properties to restart (“roll over” the file) e.g. every 1000MB, which should enable collection of a series of trace files covering the process from end to end.
Check “Restart the data collector set at limits.”
Check “Maximum Size”.
Enter your chosen Maximum Size per file.

