Quick and easy debugging in AX 7
This purpose of this blog is to show how you can get quickly get started with debuggingin AX7, specifically by showing how you can debug an error message issued from AX.
So, let’s begin !
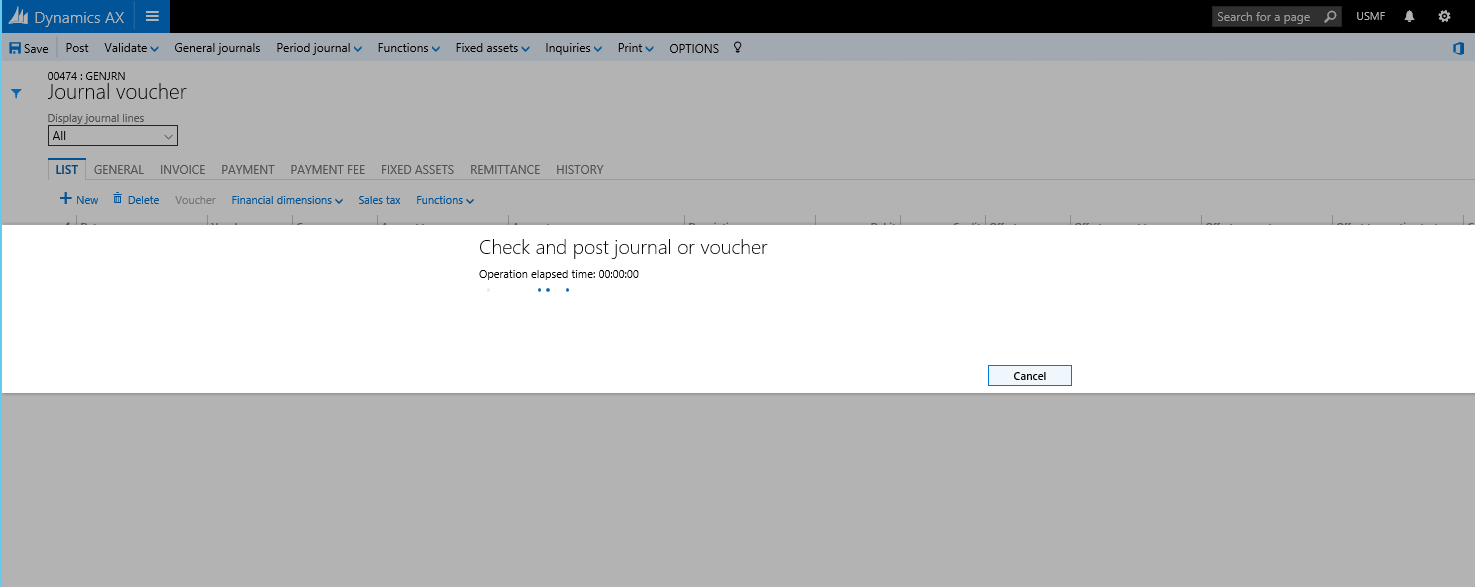
Imagine you are posting a Bank journal and you get the following error message upon posting ‘Currency EUR not allowed for account USMF OPER’
You would like to know the logic behind this error message, but need to trace in the code where it was issued from
We will use a classic debugging technique known from AX 2012 to demonstrate how this can be done quickly and easily, by inserting a breakpoint on the Info class to enable the debugger to track down in the code where the error is generated from.
These are the steps
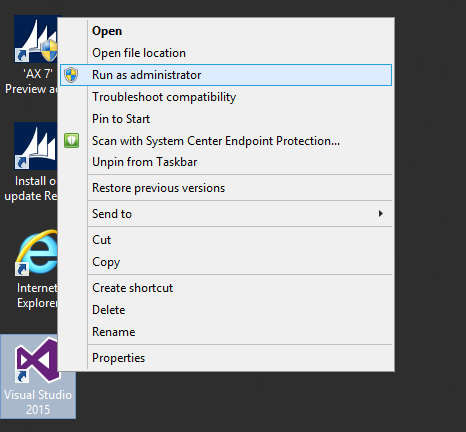
- Start Visual Studio as ‘Administrator’
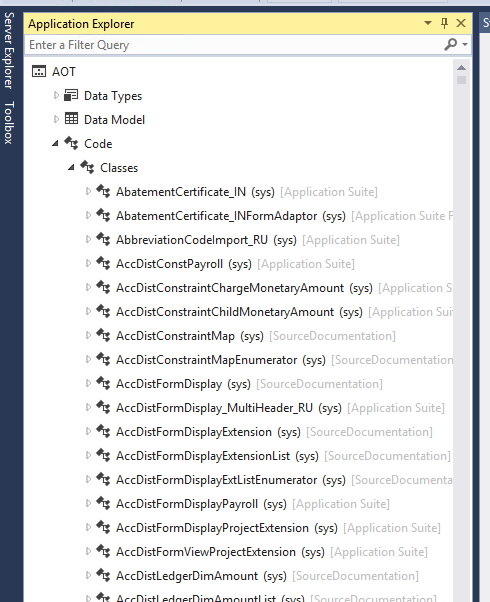
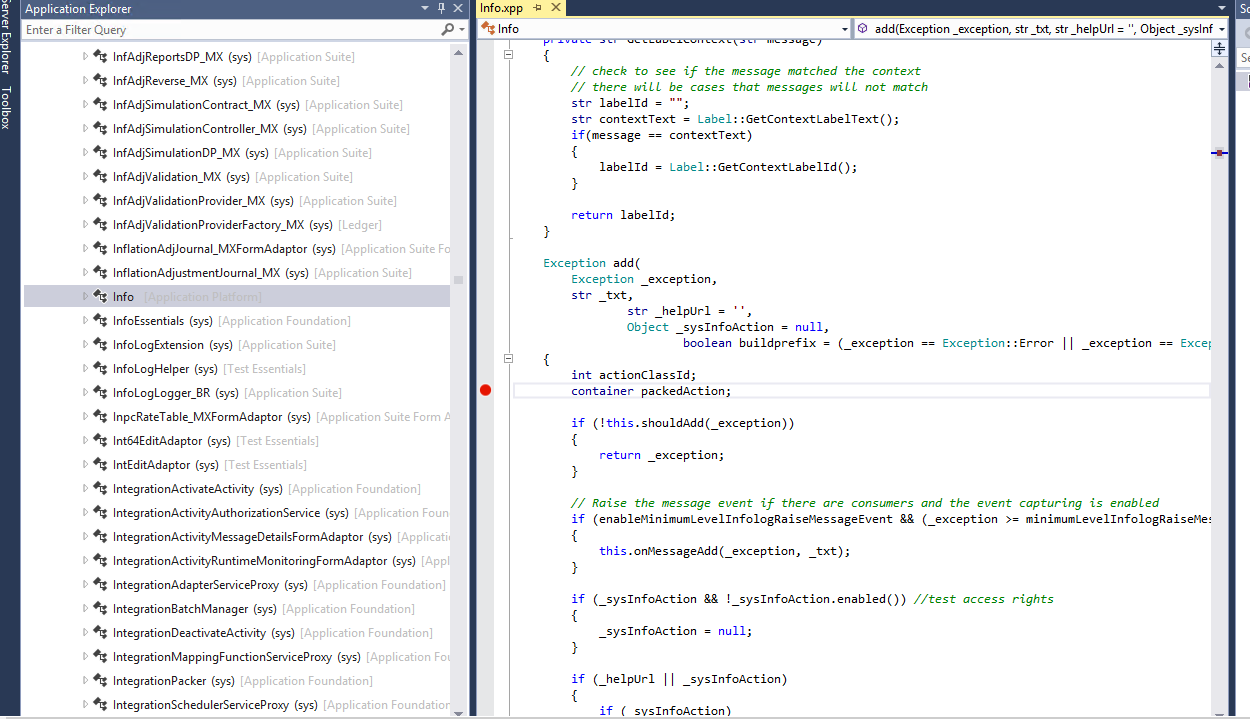
2. Go to the Application explorer, go to the ‘Code’ node, select ‘Classes’ and locate the ‘Info’ class
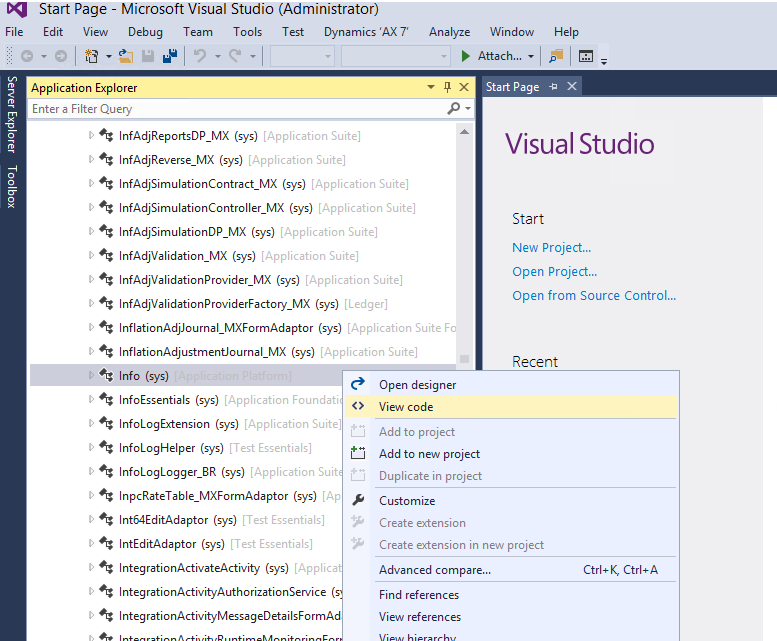
On the ‘Info’ class rightclick and select ‘View code’
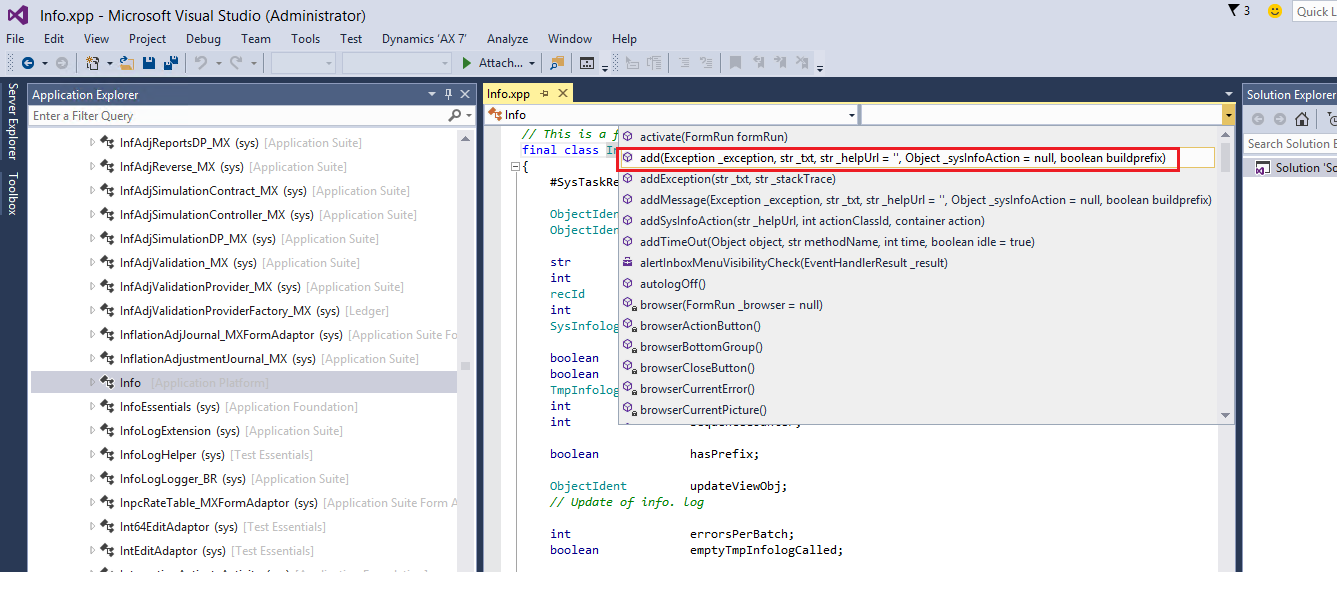
In the window that opens up, select the ‘Add’ method
3. Insert your breakpoint on the ‘Add’ method by pressing ‘F9’
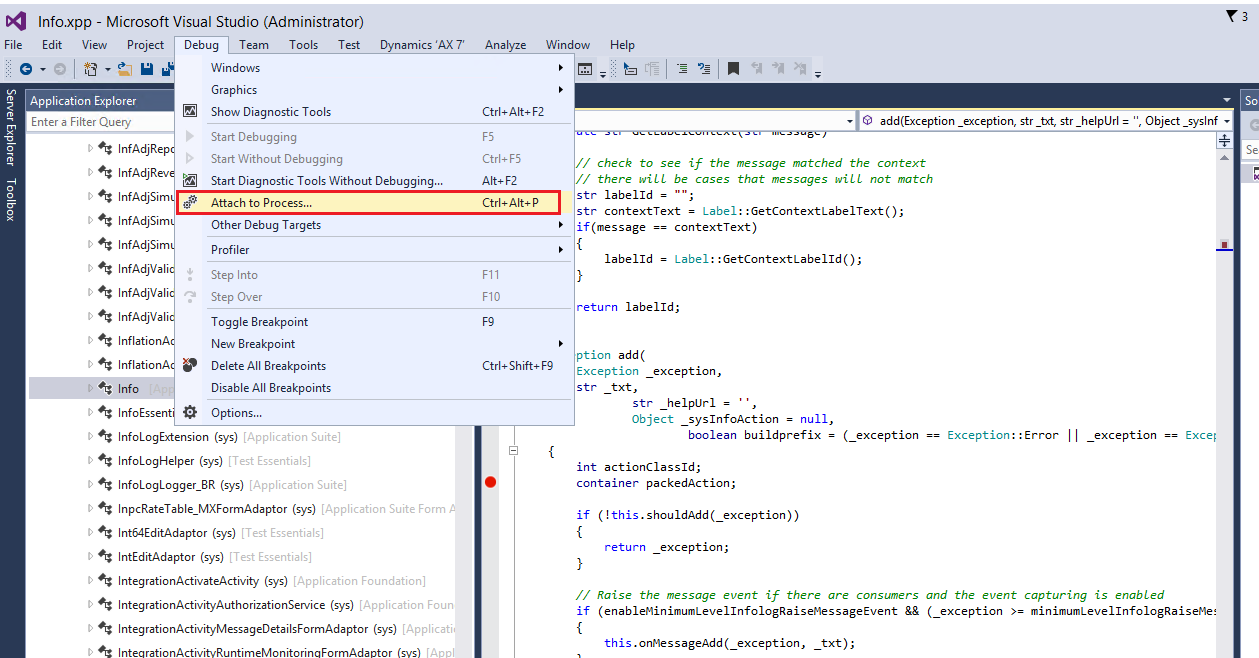
4. Press ‘Debug’ from the toolbar and select ‘Attach to process’
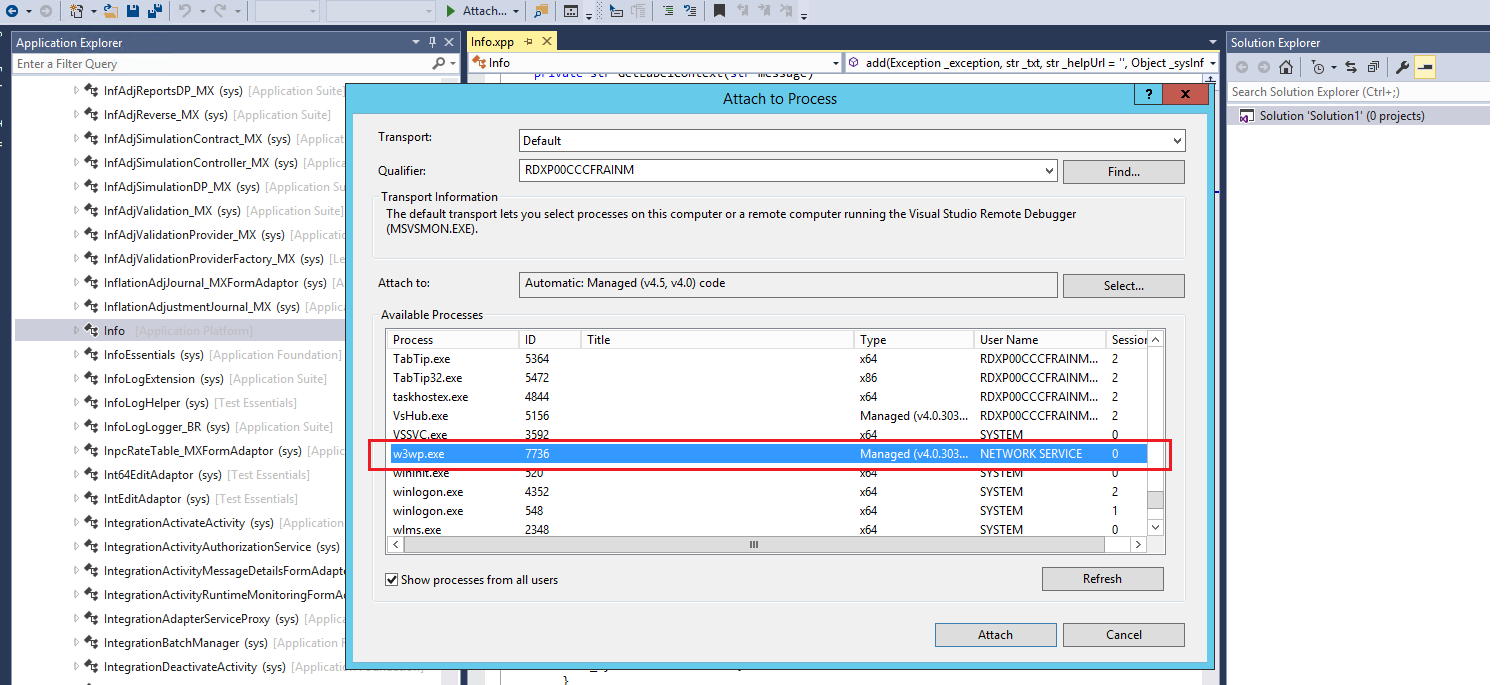
In the ‘Attach to process’ screen mark ‘Show processes from all users’ and then browse to
the process ‘w3wp.exe’
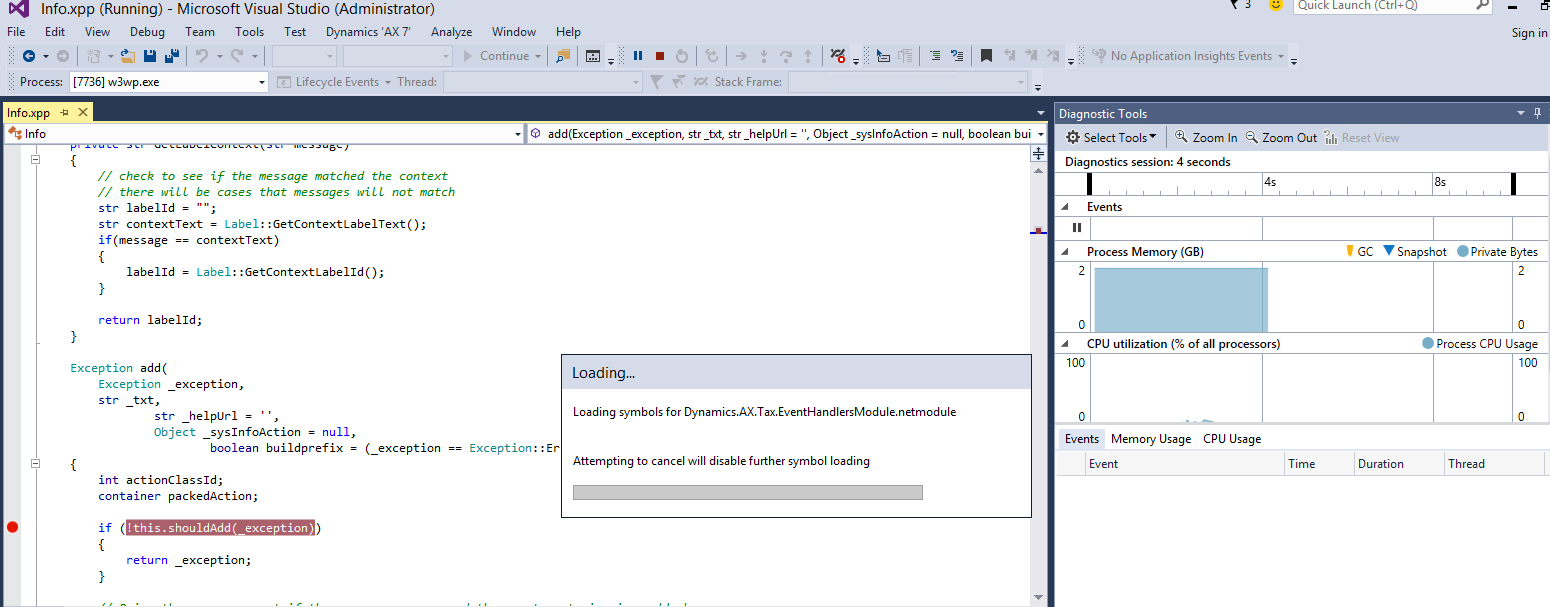
Wait for the Symbols to load
5. Once the symbols have loaded repeat the application procedure, eg. in this case we will post the journal again to generate the error message
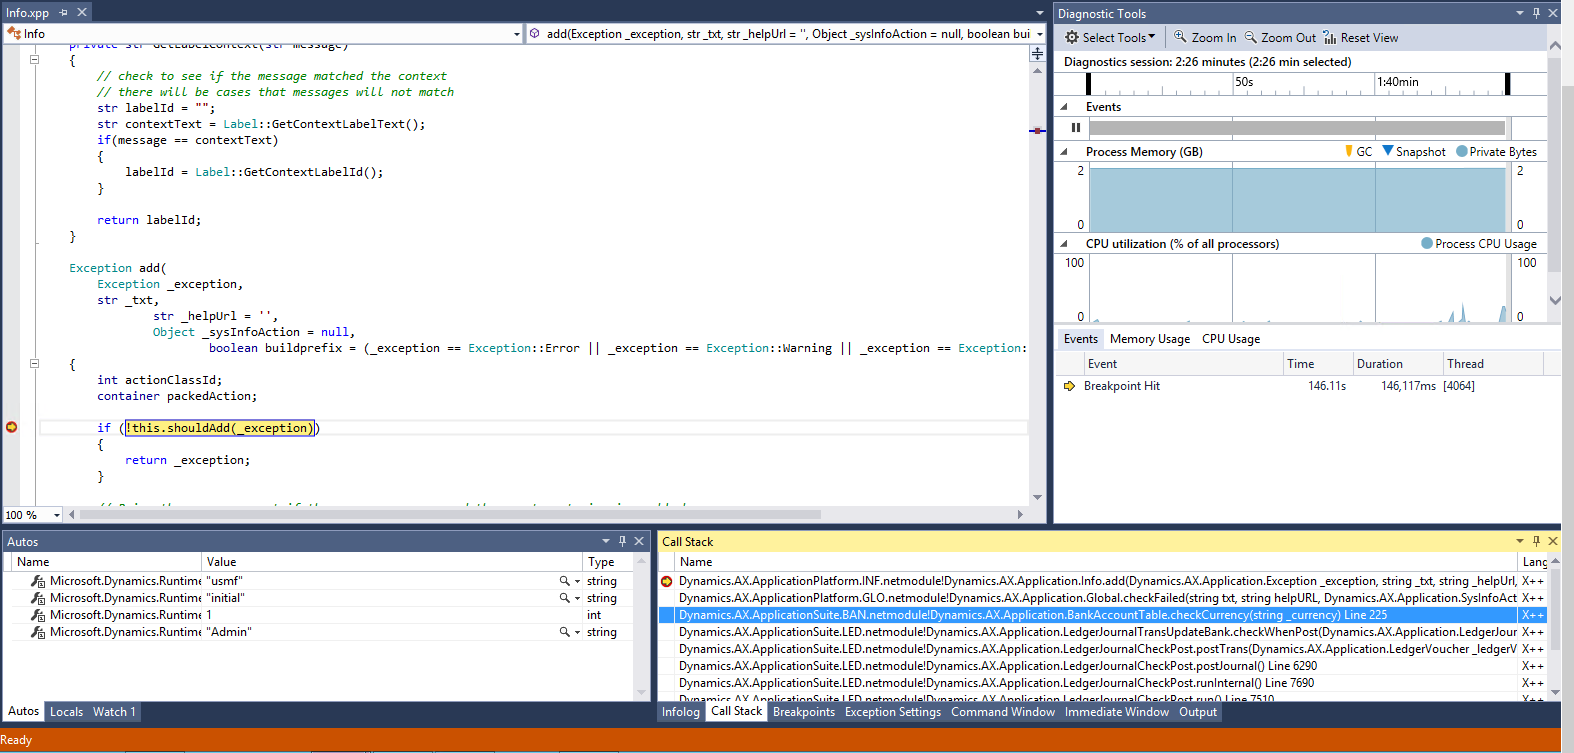
And note that almost immediately the debugger starts executing in Visual Studio
I copy the call stack into Notepad and here I note especially the highlighted line as this is the line that is triggered just before the call to the Infolog code
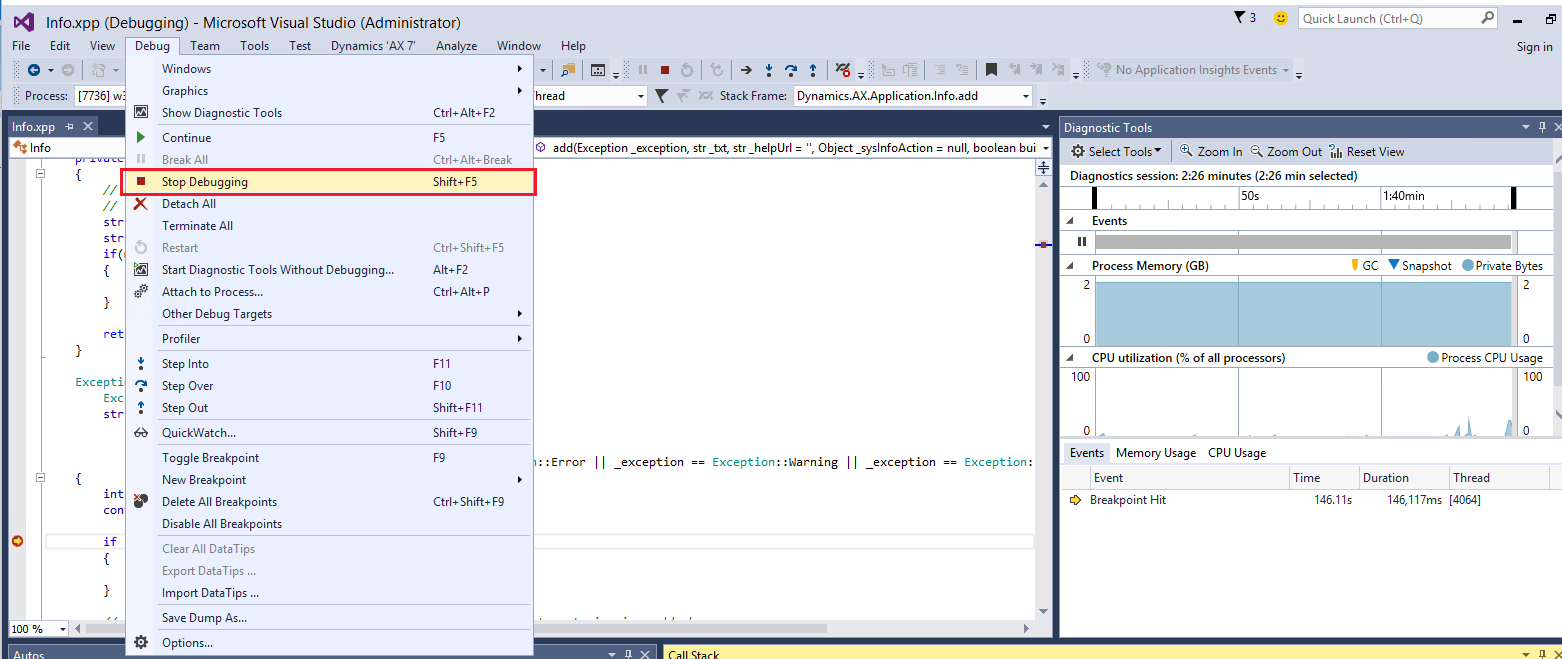
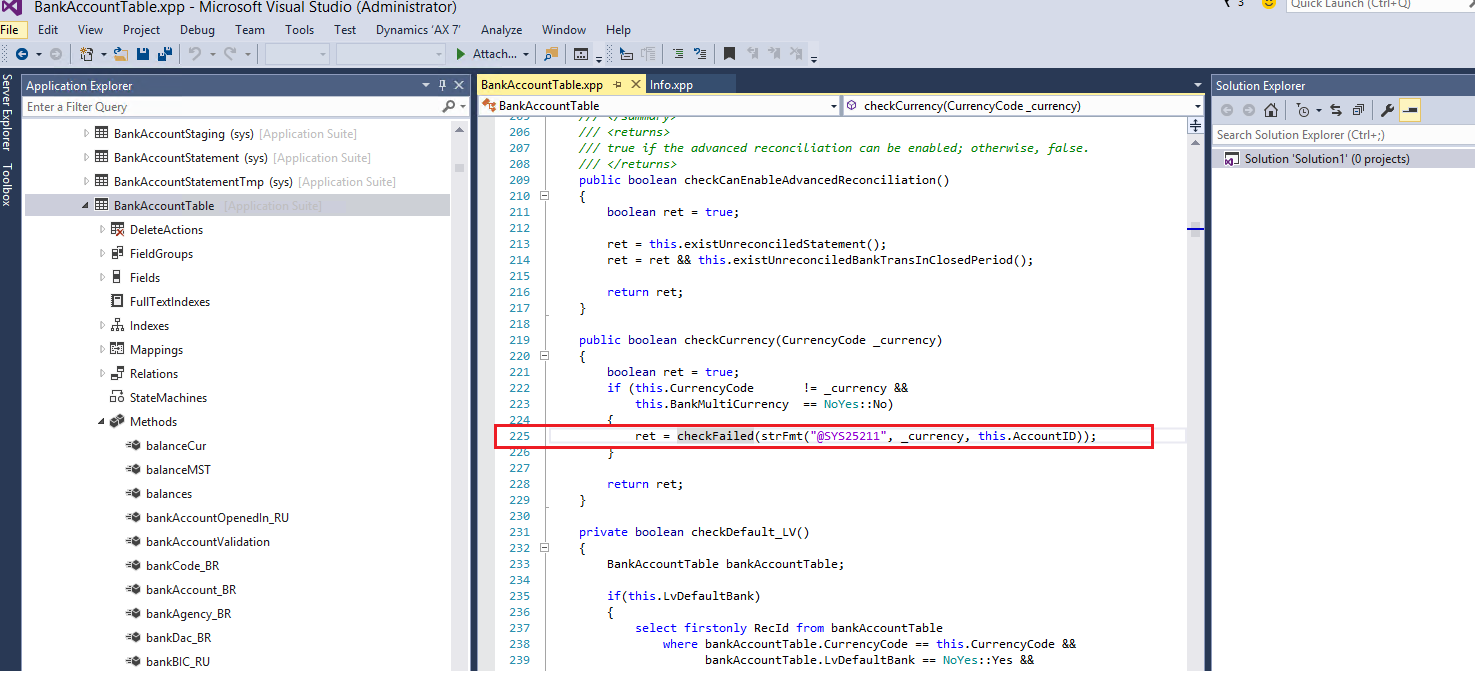
I can see that the error is triggered on the BankAccountTable, checkCurrency method on line 225 and I stop debugging
I go to this code to study the method
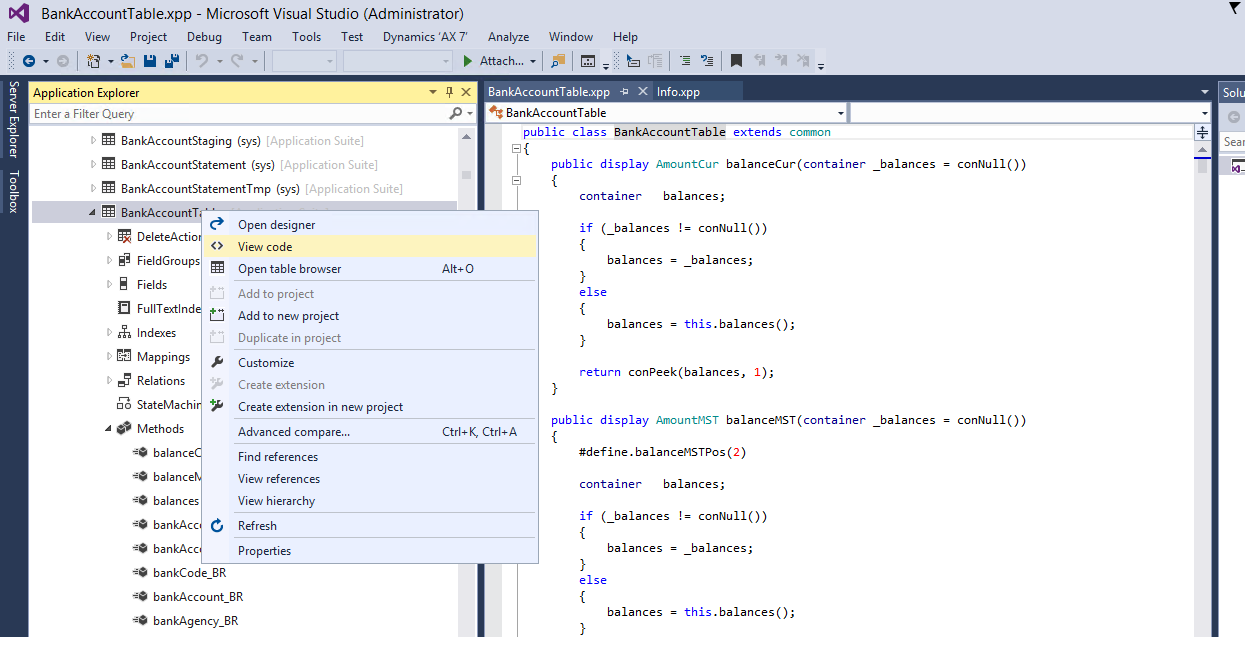
I open up the BankAccountTable and similar to as on the ‘Info’ class I select ‘View Code’ and open the method I am interested in
Here naturally ‘checkCurrency’
And we can study the code that generated the error message
Naturally, you can use the same technique to insert breakpoints in other places of the code such as on ‘init’, ‘update’ and ‘insert’ methods etc
Happy debugging !


