


Executive summary
Global adoption of artificial intelligence continued to rise in the second half of 2025, increasing by 1.2 percentage points compared to the first half of the year, with roughly one in six people worldwide now using generative AI tools, remarkable progress for a technology that only recently entered mainstream use.
To track this trend, we measure AI diffusion as the share of people worldwide who have used a generative AI product during the reported period. This measure is derived from aggregated and anonymized Microsoft telemetry and then adjusted to reflect differences in OS and device-market share, internet penetration, and country population. Additional details on the methodology are available in our AI Diffusion technical paper. 1
No single metric is perfect, and this one is no exception. Through the Microsoft AI Economy Institute, we continue to refine how we measure AI diffusion globally, including how adoption varies across countries in ways that best advance priorities such as scientific discovery and productivity gains. For this report, we rely on the strongest cross-country measure available today, and we expect to complement it over time with additional indicators as they emerge and mature.
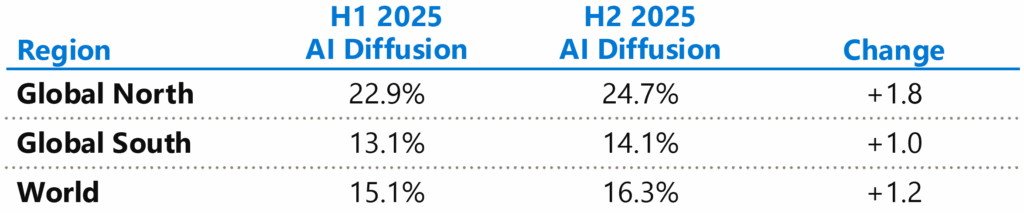
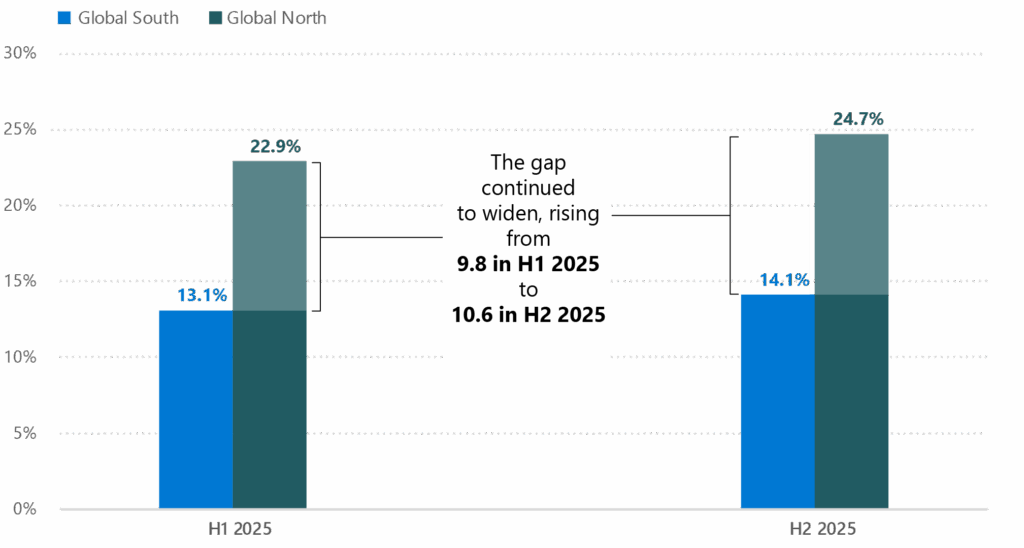
Despite progress in AI adoption, the data shows a widening divide: adoption in the Global North grew nearly twice as fast as in the Global South. As a result, 24.7 percent of the working age population in the Global North is now using these tools, compared to only 14.1 percent in the Global South.
AI Diffusion by Economy H2 2025
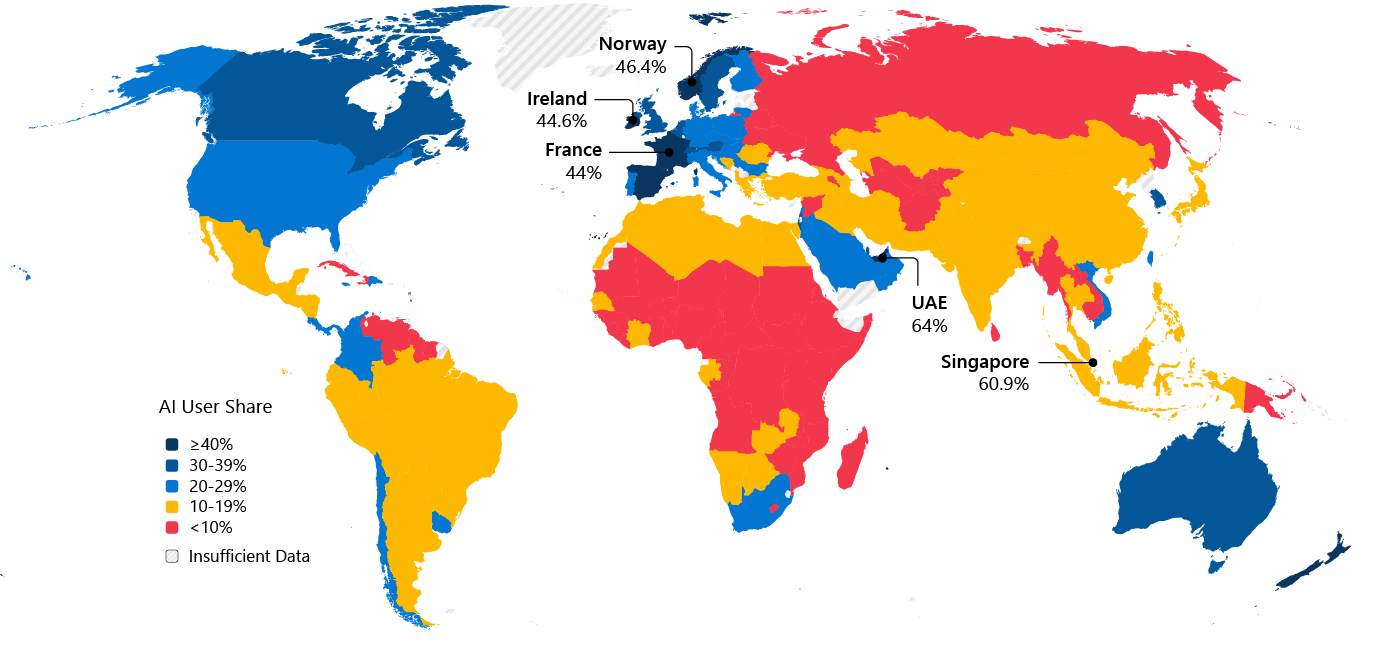
Countries that have invested early in digital infrastructure, AI skilling, and government adoption, such as the United Arab Emirates, Singapore, Norway, Ireland, France, and Spain, continue to lead. The UAE extended its lead as the #1 ranked country, with 64.0 percent of the working age population using AI at the end of 2025, compared to 59.4 percent earlier in the year. The UAE has opened a lead of more than three percentage points over Singapore, which continues in second place with 60.9 percent adoption.
AI Diffusion by Economy H2 2025
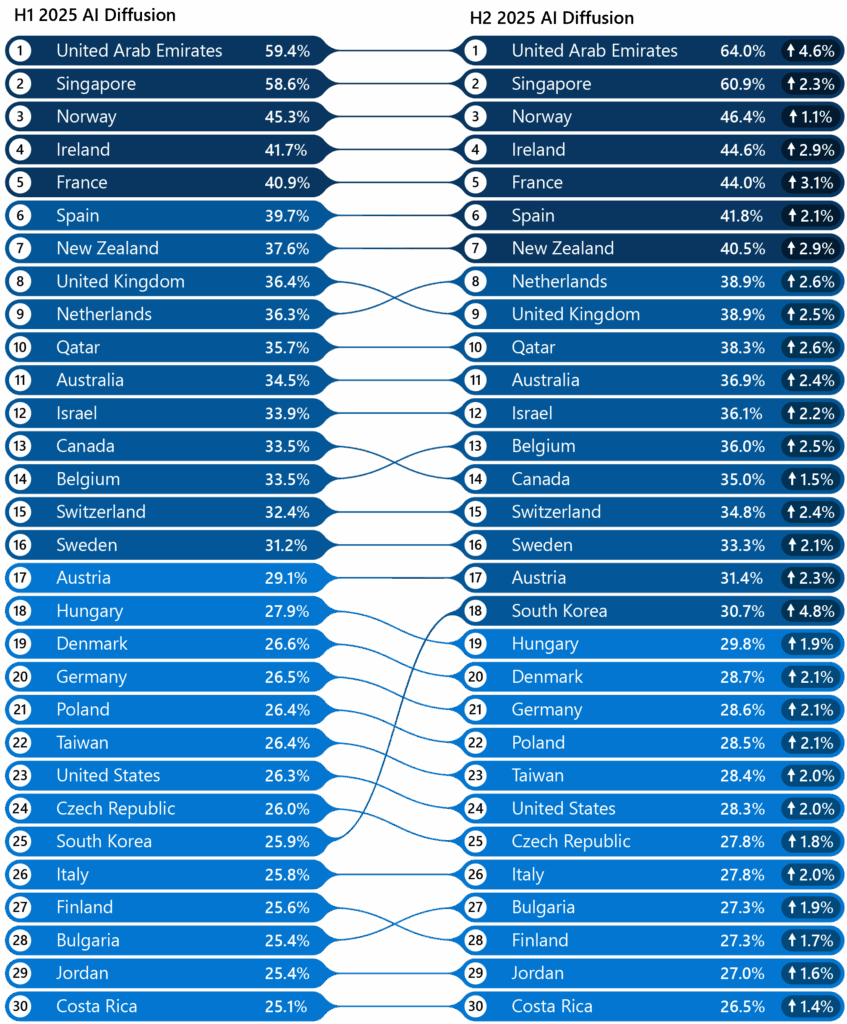
The second half of the year in the United States shows that leadership in innovation and infrastructure, while critical, does not by themselves lead to broad AI adoption. The U.S. leads in both AI infrastructure and frontier model development, but it fell from 23rd to 24th place in AI usage among the working age population, with a 28.3 percent usage rate. It lags far behind smaller, more highly digitized and AI-focused economies.
South Korea stands out as the clearest end-of-year success story. It surged seven spots in the global rankings, climbing from 25th to 18th, driven by government policies, improved frontier model capabilities in the Korean language, and consumer-facing features that resonated with the population. Generative AI is now used in schools, workplaces, and public services, and South Korea has become one of ChatGPT’s fastest-growing markets, leading OpenAI to open an office in Seoul. 2
AI Diffusion Over Time by Country
A parallel development reshaping the global landscape in 2025 was the rapid rise of DeepSeek, an open-source AI platform that has gained significant traction in markets long underserved by traditional providers. By releasing its model under an open-source MIT license and offering a completely free chatbot, DeepSeek removed both financial and technical barriers that limit access to advanced AI. Its strongest adoption, not surprisingly has emerged across China, Russia, Iran, Cuba, and Belarus. But perhaps even more notable is DeepSeek’s surging popularity across Africa, where it is aided by strategic promotion and partnerships with firms such as Huawei. 3
This rapid evolution underscores an increasingly important dimension of AI competition between the United States and China, involving a race to promote adoption of their respective national models. DeepSeek’s success reflects growing Chinese momentum across Africa, a trend that may continue to accelerate in 2026. DeepSeek’s ascent also underscores a broader truth: the global diffusion of AI is influenced by accessibility factors, and the next wave of users may come from communities that have historically had limited access to technological progress. The challenge ahead is ensuring that innovation spreads in ways that help narrow divides rather than deepen them.
Changes in the second half of 2025
New data from the second half of 2025 shows the world is using artificial intelligence at record levels, but it also reveals a widening divide. Global adoption of generative AI tools reached 16.3 percent of the world’s population, up from 15.1 percent in the first half of 2025, a meaningful gain for technologies still in their early years. Today, roughly one in six people are using AI to learn, work, or solve problems.
Yet this progress is uneven. Adoption in the Global North grew almost twice as fast as in the Global South, widening the gap from 9.8 to 10.6 percentage points. In short, AI’s benefits are expanding, but they are not expanding equally.
AI User Share in the Global South and Global North
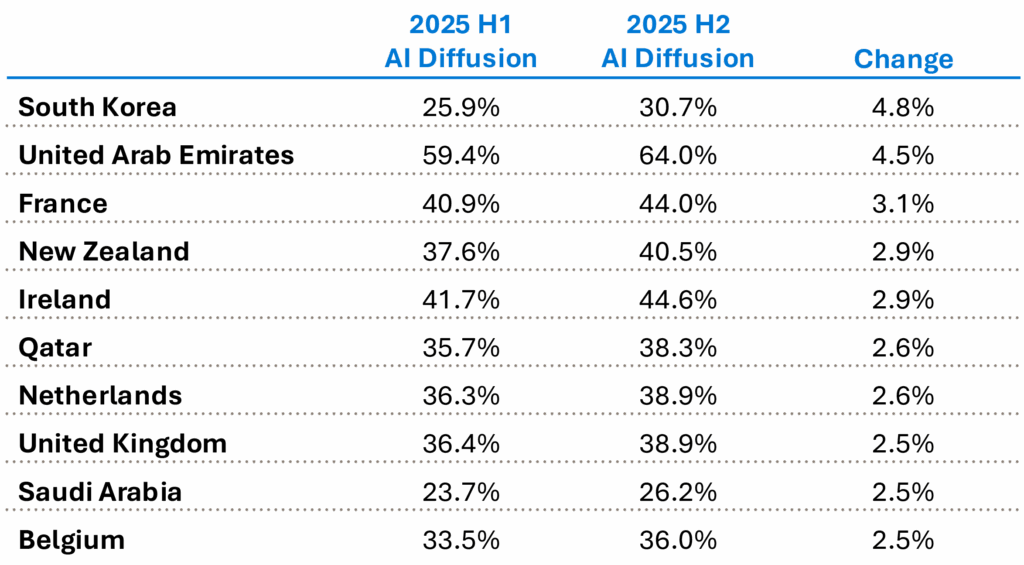
When looking at the economies driving the fastest gains, the imbalance becomes even clearer. Of the ten countries with the largest increases in AI adoption share, all are high-income economies. South Korea and the United Arab Emirates stand out, each posting growth rates above four percentage points, underscoring how concentrated recent momentum has been among already AI-established economies.
AI Adoption Share Over Time
Among the top 30 countries, the overall rankings remained steady. Nations that have invested early and consistently in digital infrastructure continue to lead. The United Arab Emirates and Singapore again hold the top two positions, followed by Norway, Ireland, France, and Spain. Most other countries shifted little, reinforcing how saturated the top of the list has become.
A few changes stand out. South Korea made the largest move of the half, rising seven spots from 25th to 18th, a clear signal of accelerated national investment and adoption. Belgium moved ahead of Canada, and the Netherlands passed the United Kingdom, but these were modest adjustments in an otherwise stable group. The United States maintained strong usage in absolute numbers, but dropped from 23rd to 24th place, reflecting the fact that a smaller proportion of the US population uses AI compared to several smaller highly digitized nations.
Taken together, the data shows a world embracing AI at remarkable speed, even as the divide between leading and lagging regions grows. The challenge ahead is ensuring that this next wave of innovation benefits more people, in more places, and not fewer.
South Korea’s AI Surge: Policy, Models, and a Viral Cultural Moment
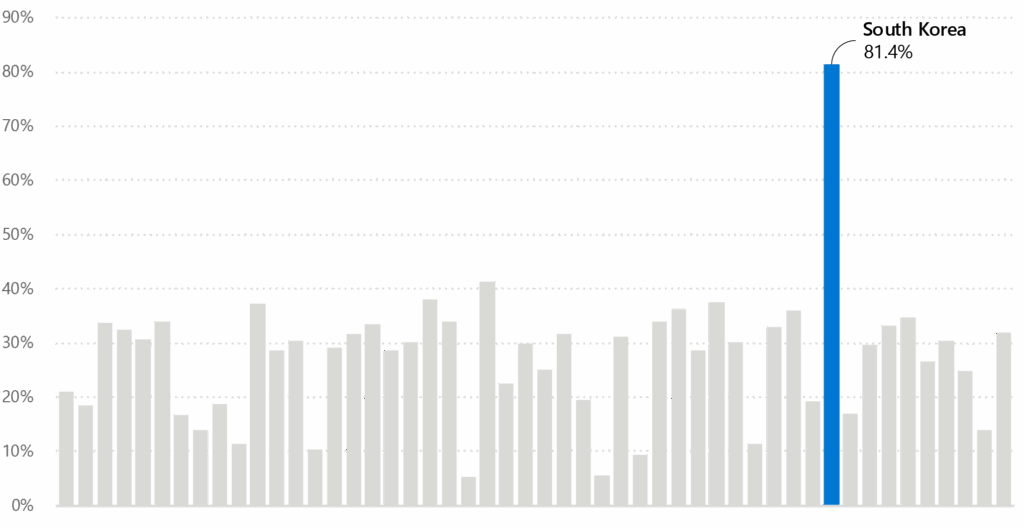
South Korea stands out in H2 2025 as the only country to make a dramatic leap in global AI adoption. In just three months, it climbed seven positions, from 25th to 18th, the largest rise of any nation this half. Generative‑AI usage grew from ~26% to over 30% of the population, bringing total growth since October 2024 to more than 80%, far outpacing the global average (35%) and the U.S. (25%). South Korea is now the world’s second‑largest ChatGPT subscriber market, behind only the U.S. 4 The drivers for this increase include: 1) national policies accelerating AI integration, 2) frontier model improvements for the Korean language, and 3) consumer-facing features that resonated with the population.
AI User Base Growth H1 2025 to H2 2025
National Policies Accelerating AI Integration
From July through November 2025, South Korea moved from high-level strategic vision to concrete, institutionalized action on AI. In September, the government reconstituted its national AI coordinating body as the National AI Strategy Committee, a cross-ministerial decision-making group. 5 It also enacted the AI Basic Act, legislation that balances innovation with AI governance. 6 Together, these moves created formal mechanisms to scale AI infrastructure, regulatory coordination, and public-sector deployments.
In late 2025, the government also announced plans to expand AI-focused science high schools in regional areas and strengthen partnerships between major universities and regional institutes, widening the AI talent pipeline beyond metropolitan centers. 7 Together, these decisions between July and November 2025 establish governance, planning, and education measures that support broad-based AI adoption across institutions and the general population.
Frontier Model Improvements for the Korean Language
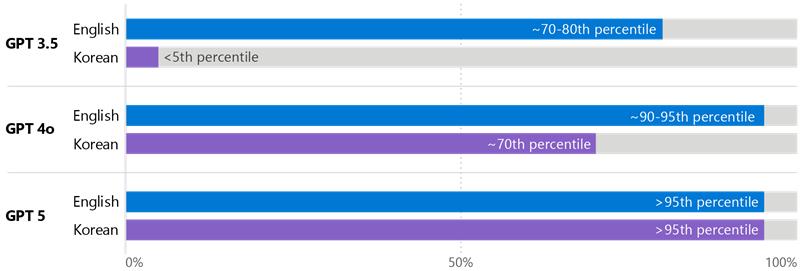
While South Korea’s public and government appetite for AI was strong, the capabilities of large language models in Korean had not kept pace. That changed in April 2025, when OpenAI released its 4o model for all users, which had greatly increased capability in the Korean language, and again with the August 2025 release of GPT-5. Model performance on the Korean SAT (CSAT) benchmark—a widely used measure of scholastic aptitude for university applicants—rose dramatically: GPT-3.5 (the best model available on the free tier at the time) scored 16, GPT-4o reached 75, and GPT-5 achieved 100. 8 This represented a shift from below adult reading proficiency to performance on par with top‑tier college students.
Percentile-equivalent comparison on college admissions exams (English vs Korean)
For Korean-speaking users, GPT4o was the turning point, making everyday tasks- conversation, drafting, translation, and analysis- practical and reliable with large language models for the first time. ChatGPT-5 extended this improvement further, adding deeper reasoning, sharper linguistic precision, and stronger context handling. These advances unlocked reliable support for complex instructions, specialized domain queries, education, professional workflows, and small-business applications. Though Korean is not a low-resource language, this rapid improvement in Korean-language performance offers an encouraging signal for countries whose languages are underrepresented in LLM training data: as models expand and deepen linguistic coverage, usage is likely to follow.
A Viral Image-Generation Moment That Captured Public Imagination
A third driver of South Korea’s AI surge was triggered by a cultural phenomenon in April 2025, when Ghibli‑style images generated with ChatGPT‑4o went viral across Korean social platforms. 12 The feature’s simplicity- no technical skills required, instantly shareable results- introduced AI to millions of first‑time users and triggered a spike in image‑generation activity. 13 Engagement data suggests many continued exploring additional AI capabilities after the trend faded, turning a viral moment into lasting adoption. Combined with national policy action and major improvements in Korean‑language model performance, this consumer‑level spark helped propel South Korea to the largest increase in AI usage worldwide, led to rapid growth in the ChatGPT market, and resulted in expanded integration of AI across public services by late 2025.
The UAE’s Deliberate AI Strategy
The United Arab Emirates’ AI advantage didn’t materialize overnight. It was built deliberately and with years of foresight. In October 2017, five full years before ChatGPT captured the world’s attention, the UAE appointed the world’s first Minister of State for Artificial Intelligence, His Excellency Omar Sultan Al Olama. That same year, the UAE launched a national AI strategy covering 9 priority sectors, establishing governance frameworks while many governments were still debating whether AI warranted dedicated policy attention at all. 14 This sequencing proved consequential. When the current generative AI wave arrived, UAE residents encountered a familiar technology, one their government had been deploying in public services and discussing in national conversations for half a decade. The foundation was already in place. The results show up clearly in the data. The 2025 Edelman Trust Barometer places UAE AI trust at approximately 67%. The United States, by contrast, registers just 32%. 15 Western European nations average the same. That’s a 35 percentage point gap, one of the starkest cross-national differentials in technology attitudes we can measure today.
Regulatory pragmatism has also advanced the UAE’s global AI leadership. The UAE was forward-thinking in creating sandbox environments that enabled controlled experimentation. 16 It created special visa programs to attract AI talent. 17 It adopted principles-based guidelines that provided clear direction without creating compliance paralysis. The approach generated trust in a timeless fashion: through demonstrated outcomes, and through AI that actually works in daily transactions.
DeepSeek’s Dramatic Rise: Open-Source AI Gains Ground in New Markets
One of 2025’s most unexpected developments was the rise of DeepSeek, a new AI entrant that surprised the industry with a flagship model capable of competing with top U.S. systems. Its defining feature was openness: DeepSeek released its model weights under an MIT License, giving developers global access to inspect, adapt, and build on its core engine, an approach that immediately resonated with open‑source communities.
DeepSeek Market Share
DeepSeek coupled this with an entirely free‑to‑use chatbot on web and mobile. The absence of subscription fees or payment requirements lowered the barrier for millions of users, especially in price‑sensitive regions. Reflecting this open ethos, the company invited independent researchers in September 2025 to rigorously test the model’s performance, aiming for publication in Nature, an unusually transparent move for an emerging AI player. 18
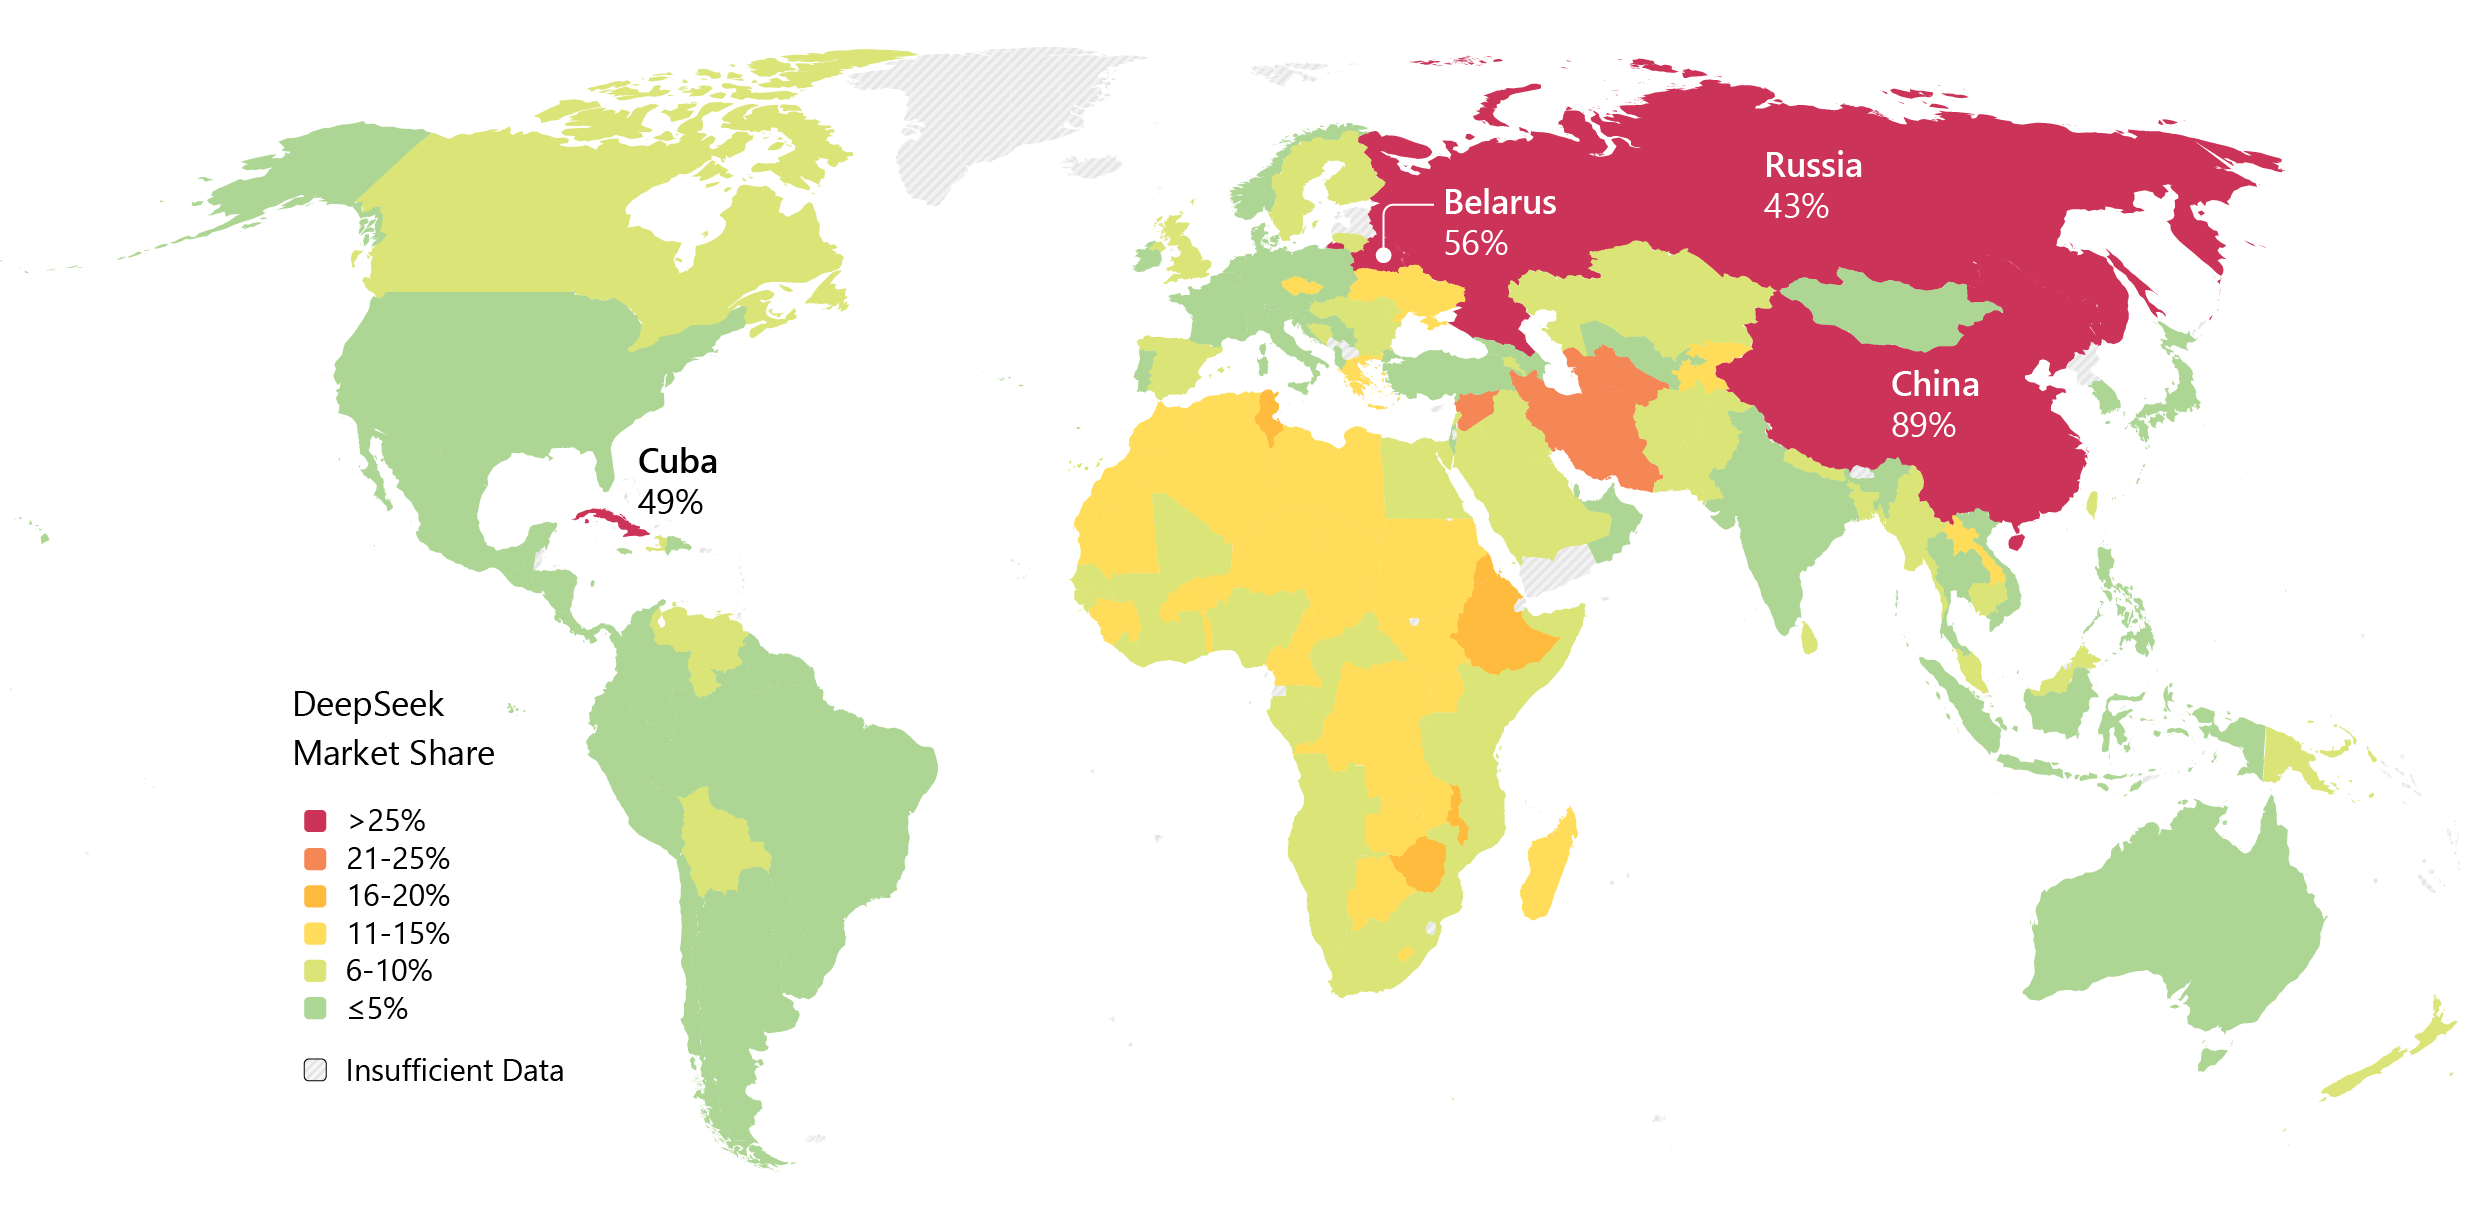
This combination of openness and affordability allowed DeepSeek to gain traction in markets underserved by Western AI platforms. Adoption remained low in North America and Europe, but surged in China, Russia, Iran, Cuba, Belarus, and across Africa, places where U.S. services face restrictions or where foreign tech access is limited. In Africa in particular, DeepSeek usage is estimated to be 2 to 4× higher than in other regions. By contrast, countries where entrenched alternatives already meet local needs, such as Israel and South Korea, show minimal uptake.
Several factors explain this pattern. DeepSeek’s free service eliminated the cost barriers (requiring credit cards or paid upgrades) associated with Western models. 19 In addition, Chinese technology companies, including DeepSeek and infrastructure partners like Huawei, actively promoted and deployed the platform in African markets through partnerships, outreach, and integration with telecom services. 20 DeepSeek benefited from being open, free, and strategically distributed in regions often excluded from the first wave of AI adoption. This dynamic also highlights how open‑source AI can function as a geopolitical instrument, extending Chinese influence in areas where Western platforms cannot easily operate. 21
From a governance standpoint, DeepSeek’s rise shows that global AI adoption is shaped as much by access and availability as by model quality. Users gravitate toward platforms that fit their economic, linguistic, and political context. The rapid spread of an open model also raises questions about standards and safety, as open-source systems can propagate widely with limited oversight. Still, DeepSeek has clearly lowered entry barriers for millions, suggesting that the next billion AI users may emerge not from traditional tech hubs but from the Global South, enabled by open-source innovation.
AI Diffusion Data Source
| Economy | H1 2025 AI Diffusion | H2 2025 AI Diffusion | Change |
|---|---|---|---|
| United Arab Emirates | 59.4% | 64.0% | 4.5% |
| Singapore | 58.6% | 60.9% | 2.3% |
| Norway | 45.3% | 46.4% | 1.1% |
| Ireland | 41.7% | 44.6% | 2.9% |
| France | 40.9% | 44.0% | 3.1% |
| Spain | 39.7% | 41.8% | 2.1% |
| New Zealand | 37.6% | 40.5% | 2.9% |
| Netherlands | 36.3% | 38.9% | 2.6% |
| United Kingdom | 36.4% | 38.9% | 2.5% |
| Qatar | 35.7% | 38.3% | 2.6% |
| Australia | 34.5% | 36.9% | 2.4% |
| Israel | 33.9% | 36.1% | 2.2% |
| Belgium | 33.5% | 36.0% | 2.5% |
| Canada | 33.5% | 35.0% | 1.5% |
| Switzerland | 32.4% | 34.8% | 2.5% |
| Sweden | 31.2% | 33.3% | 2.2% |
| Austria | 29.1% | 31.4% | 2.2% |
| South Korea | 25.9% | 30.7% | 4.8% |
| Hungary | 27.9% | 29.8% | 1.9% |
| Denmark | 26.6% | 28.7% | 2.1% |
| Germany | 26.5% | 28.6% | 2.1% |
| Poland | 26.4% | 28.5% | 2.1% |
| Taiwan | 26.4% | 28.4% | 2.0% |
| United States | 26.3% | 28.3% | 2.1% |
| Czechia | 26.0% | 27.8% | 1.8% |
| Italy | 25.8% | 27.8% | 2.0% |
| Bulgaria | 25.4% | 27.3% | 1.9% |
| Finland | 25.6% | 27.3% | 1.7% |
| Jordan | 25.4% | 27.0% | 1.6% |
| Costa Rica | 25.1% | 26.5% | 1.4% |
| Slovenia | 24.6% | 26.5% | 2.0% |
| Saudi Arabia | 23.7% | 26.2% | 2.5% |
| Lebanon | 24.8% | 25.7% | 0.9% |
| Oman | 22.6% | 24.2% | 1.6% |
| Portugal | 22.4% | 24.2% | 1.8% |
| Slovakia | 22.1% | 23.8% | 1.7% |
| Croatia | 21.8% | 23.7% | 1.9% |
| Vietnam | 21.2% | 23.5% | 2.3% |
| Dominican Republic | 22.0% | 22.7% | 0.8% |
| Uruguay | 20.9% | 22.5% | 1.6% |
| Lithuania | 21.0% | 22.4% | 1.3% |
| Jamaica | 22.2% | 22.1% | -0.1% |
| Colombia | 20.4% | 22.0% | 1.6% |
| Panama | 20.3% | 21.5% | 1.2% |
| Serbia | 19.7% | 21.5% | 1.8% |
| South Africa | 19.3% | 21.1% | 1.8% |
| Chile | 19.6% | 20.8% | 1.2% |
| Malaysia | 18.3% | 19.7% | 1.4% |
| Argentina | 17.8% | 19.6% | 1.8% |
| Bosnia And Herzegovina | 18.2% | 19.5% | 1.3% |
| Kuwait | 17.7% | 19.1% | 1.4% |
| Greece | 17.7% | 19.1% | 1.4% |
| Japan | 16.7% | 19.1% | 2.4% |
| Philippines | 17.1% | 18.3% | 1.2% |
| Georgia | 17.3% | 18.2% | 0.9% |
| Mexico | 16.7% | 17.8% | 1.1% |
| Ecuador | 17.0% | 17.7% | 0.8% |
| Brazil | 15.6% | 17.1% | 1.5% |
| Moldova | 16.6% | 17.0% | 0.4% |
| Albania | 15.8% | 16.5% | 0.7% |
| China | 15.4% | 16.3% | 0.9% |
| Romania | 15.3% | 16.2% | 0.9% |
| El Salvador | 14.6% | 16.2% | 1.6% |
| India | 14.2% | 15.7% | 1.4% |
| Azerbaijan | 14.2% | 15.5% | 1.3% |
| Guatemala | 13.7% | 14.8% | 1.1% |
| Peru | 13.4% | 14.7% | 1.2% |
| Türkiye | 13.4% | 14.6% | 1.2% |
| Mongolia | 12.6% | 14.3% | 1.7% |
| Namibia | 13.0% | 13.8% | 0.9% |
| Libya | 12.7% | 13.7% | 1.1% |
| Kazakhstan | 12.7% | 13.7% | 1.1% |
| Botswana | 12.8% | 13.7% | 0.9% |
| Gabon | 12.3% | 13.4% | 1.1% |
| Economy | H1 2025 AI Diffusion | H2 2025 AI Diffusion | Change |
|---|---|---|---|
| Egypt | 12.5% | 13.4% | 0.9% |
| Honduras | 12.4% | 13.1% | 0.7% |
| Nepal | 12.3% | 13.0% | 0.8% |
| Senegal | 12.4% | 12.9% | 0.5% |
| Indonesia | 11.7% | 12.7% | 1.1% |
| Tunisia | 12.3% | 12.7% | 0.4% |
| Zambia | 11.7% | 12.3% | 0.5% |
| Algeria | 11.3% | 12.0% | 0.8% |
| Cote D’Ivoire | 10.8% | 11.7% | 0.8% |
| Bolivia | 10.9% | 11.6% | 0.7% |
| Iraq | 10.3% | 11.2% | 0.9% |
| Paraguay | 10.1% | 11.0% | 0.9% |
| Morocco | 10.5% | 10.9% | 0.3% |
| Gambia | 10.6% | 10.9% | 0.2% |
| Thailand | 9.1% | 10.7% | 1.6% |
| Nicaragua | 10.0% | 10.7% | 0.7% |
| Iran | 9.6% | 10.7% | 1.1% |
| Pakistan | 9.7% | 10.3% | 0.7% |
| Angola | 8.9% | 9.7% | 0.8% |
| Madagascar | 8.9% | 9.7% | 0.8% |
| Malawi | 8.9% | 9.7% | 0.8% |
| Mozamb-ique | 8.9% | 9.7% | 0.8% |
| Benin | 8.7% | 9.3% | 0.6% |
| Burkina Faso | 8.7% | 9.3% | 0.6% |
| Ghana | 8.7% | 9.3% | 0.6% |
| Guinea | 8.7% | 9.3% | 0.6% |
| Guinea-Bissau | 8.7% | 9.3% | 0.6% |
| Liberia | 8.7% | 9.3% | 0.6% |
| Mali | 8.7% | 9.3% | 0.6% |
| Mauritania | 8.7% | 9.3% | 0.6% |
| Niger | 8.7% | 9.3% | 0.6% |
| Nigeria | 8.7% | 9.3% | 0.6% |
| Sierra Leone | 8.7% | 9.3% | 0.6% |
| Togo | 8.7% | 9.3% | 0.6% |
| Lesotho | 8.8% | 9.1% | 0.4% |
| Myanmar | 8.4% | 9.1% | 0.7% |
| Ukraine | 9.1% | 9.0% | -0.1% |
| French Guiana | 8.3% | 9.0% | 0.7% |
| Guyana | 8.3% | 9.0% | 0.7% |
| Suriname | 8.3% | 9.0% | 0.7% |
| Venezuela | 8.3% | 9.0% | 0.7% |
| Belarus | 7.6% | 8.4% | 0.8% |
| Kyrgyzstan | 7.6% | 8.2% | 0.7% |
| Kenya | 7.8% | 8.1% | 0.3% |
| Russia | 7.6% | 8.0% | 0.4% |
| Cameroon | 7.0% | 7.8% | 0.7% |
| Central African Republic | 7.0% | 7.8% | 0.7% |
| Chad | 7.0% | 7.8% | 0.7% |
| Congo | 7.0% | 7.8% | 0.7% |
| Congo (DRC) | 7.0% | 7.8% | 0.7% |
| Haiti | 7.1% | 7.6% | 0.5% |
| Zimbabwe | 6.9% | 7.6% | 0.6% |
| Papua New Guinea | 7.2% | 7.3% | 0.2% |
| Syria | 6.7% | 7.1% | 0.4% |
| Bangladesh | 6.5% | 7.1% | 0.6% |
| Burundi | 6.4% | 6.8% | 0.4% |
| Eritrea | 6.4% | 6.8% | 0.4% |
| Ethiopia | 6.4% | 6.8% | 0.4% |
| Somalia | 6.4% | 6.8% | 0.4% |
| South Sudan | 6.4% | 6.8% | 0.4% |
| Sudan | 6.4% | 6.8% | 0.4% |
| Tanzania | 6.4% | 6.8% | 0.4% |
| Uganda | 6.4% | 6.8% | 0.4% |
| Laos | 6.0% | 6.7% | 0.8% |
| Armenia | 6.2% | 6.6% | 0.4% |
| Sri Lanka | 6.2% | 6.6% | 0.4% |
| Uzbekistan | 5.7% | 6.3% | 0.6% |
| Rwanda | 6.0% | 6.3% | 0.2% |
| Cuba | 5.7% | 6.1% | 0.4% |
| Afghanistan | 5.1% | 5.6% | 0.4% |
| Tajikistan | 5.1% | 5.6% | 0.4% |
| Turkmenist-an | 5.1% | 5.6% | 0.4% |
| Cambodia | 4.6% | 5.1% | 0.5% |
