
This content has been archived, and while it was correct at time of publication, it may no longer be accurate or reflect the current situation at Microsoft.
At Microsoft, we adopted Azure monitor for enterprise monitoring. With Azure Monitor, we aligned our monitoring and alerting solution with the DevOps model to better support our app development methodology and put our monitoring environment in the hands of our service engineers. This led to more agile and responsive monitoring and alerting, improved measurement of end-to-end service health, and a more efficient app and service environment across the enterprise.
At Microsoft Core Services and Engineering (CSEO), our Manageability Platforms team is transforming our enterprise monitoring environment with Microsoft Azure Monitor. We’ve adopted Azure Monitor to create DevOps-driven monitoring and empower our business app engineers to take ownership of their monitoring environments. This transformation has created a new monitoring culture at Microsoft that creates a better measure of app and service health, more efficient business apps, and a solution that is better aligned with the DevOps focus that Microsoft is embracing.
Examining monitoring and alerting at Microsoft
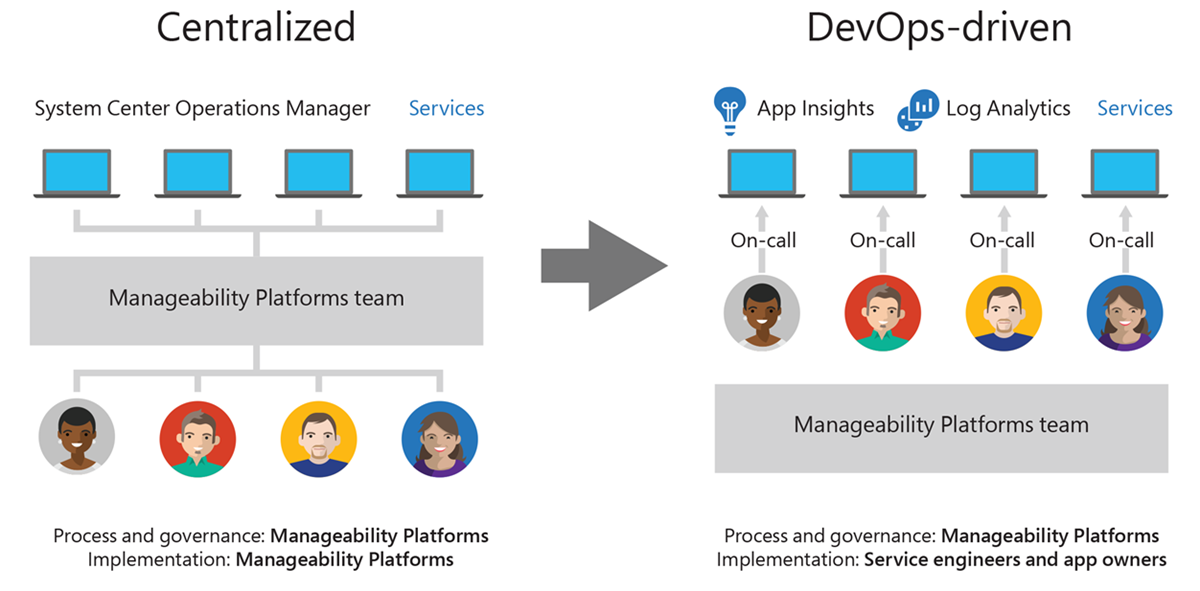
Historically, the Manageability Platforms team at CSEO has been responsible for maintaining and operating the monitoring and alerting systems for Microsoft enterprise IT resources across the globe. As a centralized service, our monitoring and alerting systems, which were based on Microsoft System Center Operations Manager (SCOM), provided status information for applications, services, and infrastructure critical to Microsoft operations. We also used SCOM to provide alert notifications to create tickets for the internal help desk and to notify application or service owners when their service wasn’t performing optimally. To provide our enterprise monitoring and alerting solution, we maintained a large SCOM environment, including:
- More than 80 SCOM servers
- 10 SCOM Gateway servers
- Six management groups
- All standard SCOM management packs, Windows, SQL, Windows Server Active Directory, and two custom management packs
- Approximately 400 configured alerts
- More than 30,000 monitored servers and devices across three domains
Centralized services and centralized management
Our monitoring and alerting environment was firmly rooted in the traditional IT model, in which the Manageability Platforms team provided a service that the rest of the organization consumed. SCOM was implemented as a centralized, server-based solution, and we hosted and managed it with a team of dedicated engineers. Meanwhile, engineers within business groups created and maintained their set of applications and services that were monitored by self-managed or hosted SCOM deployments. The breakdown of responsibilities was as follows:
- Manageability Platforms team
- Maintain and configure SCOM infrastructure.
- Administer permissions on all servers.
- Create monitors.
- Plan, create, and configure alerts and notifications.
- Create and generate reports and dashboards.
- Monitor overall infrastructure health.
- Create and resolve tickets through the help desk ticketing solution.
- Business group engineering teams
- Create and maintain apps, services, and associated infrastructure.
- Monitor app, service, and infrastructure performance, and react to monitor and alert results.
Recognizing an opportunity for DevOps in monitoring
Today, our IT services live in the cloud. More than 90 percent of Microsoft IT infrastructure is based in Microsoft Azure. Azure provides the platform on which our IT services are built, and the way that we build and operate those services has changed.
We’re nurturing a transformation to DevOps culture within IT. DevOps is the union of people, process, and products to enable continued business value to our customers. It puts technology and solution development in the hands of the people who know what the business needs, and it creates a more agile, responsive technology culture. DevOps has transformed the way that solutions are developed and operated. Microsoft is committed to Azure-first technology solutions.
Our Azure solutions offer an end-to-end view for our business groups. They’re agile, dynamic, and data-intensive. Continuous integration and continuous development (CI/CD) practices create a continual state of improvements and feature releases that enable us to embrace DevOps and create business value. As a result, the business application and service environment changes rapidly as new features and innovation drive continual service improvement.
Using Azure Monitor to enable DevOps in monitoring
Azure Monitor maximizes the availability and performance of applications by delivering a solution for collecting, analyzing, and acting on telemetry from cloud and on-premises environments. Azure Monitor provides a self-service, health-focused approach to monitoring by using tools that allow proactive and accurate identification of issues for true end-to-end monitoring.
Azure Monitor presented us with an opportunity to transform our monitoring and alerting environment to align it with the DevOps culture that our organization was adopting while simultaneously supporting those apps and teams that had not moved to DevOps. The self-service focus and scalable infrastructure allowed us to move our monitoring environment from a centrally controlled and isolated manual service to an Azure-first, DevOps-driven, distributed, and consumable service that our business groups could use to gain true insight into their app environments. We established several goals early in the process to help guide our transformation efforts:
- Democratize common monitoring and alerting management tasks. The centralized management and maintenance structure simply didn’t fit the DevOps model. We needed to put the controls for monitoring and alerting in our business app engineers’ hands and give them the freedom to create and manage their monitors, alerts, and reports.
- Create a consumable, self-service solution. To give our business app engineers control over monitoring and alerting, we needed to give them a solution that didn’t require continued centralized IT intervention. We wanted to ensure that our solution provided automation and self-service capabilities that enabled business app engineers to start creating and tuning their monitoring and alerting solution when they wanted, and to grow it at their own pace.
- Move from performance monitoring to health awareness. Individual metrics provided the raw data for our monitoring environment, but we wanted to provide a more intuitive view of the health of individual apps and the environment as a whole. The large number of platform as a service (PaaS) solutions required us to examine end-to-end health. Infrastructure monitoring and raw telemetry didn’t provide insight into the true nature of the app environment, and we wanted to expose the underlying information important to the individual business app owner.
Shifting culture from centralized IT to DevOps driven
Although the switch to Azure Monitor involved a change in technology, we quickly realized that the technology implementation wasn’t the most significant part of the process. To encourage and enable a DevOps approach to Azure Monitor, we consulted with our business groups. We then worked alongside them to help examine their current monitoring environment and better understand what it would mean for them to move to Azure Monitor.
One of the biggest parts of the migration process in general was not a specifically technical component, but instead a combination of people and process. DevOps and the agile methodology inherently give decision-making and control to those who can make the best business-focused decisions to move the solution forward. In the monitoring and alerting environment, those people were the engineers for our business apps and services. Azure provided an opportunity to give this control to the engineers from a technical perspective and empower them to direct and innovate within their own environment. We moved our way of thinking and operating from centralized IT to DevOps, under the new Azure model.
Moving to a DevOps model in Azure
The progression to Azure Monitor from SCOM included both technological and cultural shifts. The way monitors and alerts were maintained in SCOM often didn’t align with the new DevOps model in Azure. As such, the default process for moving away from SCOM began for each business group with a complete evaluation of both the SCOM-based environment and their complete app and service environment, including core business processes.
We had no concrete process for simply moving SCOM alerts, management packs, and distributed apps over to Azure Monitor because a direct transfer into Azure wasn’t logical for our business group engineers. There was no direct migration path from SCOM to Azure Monitor, and the SCOM model relied predominately on a centralized management team and on-premises infrastructure.
We determined that the best option for our business app teams was to simply start new in Azure Monitor and refactor their monitoring for the new platform. Starting fresh in Azure sounds like a complex and tedious task, but Azure’s self-service structure, combined with the support of Manageability Platforms engineers, enabled our business app teams to design and launch their monitoring solutions quickly. The business groups realized the benefit of a new, fresh environment designed to support their applications in the most effective way possible.
Aligning technology and culture
Microsoft’s business app teams were not accustomed to assuming control over—and more significantly, responsibility for—monitoring and alerting underlying infrastructure. However, because of the increased control over how their apps and services were monitored, most engineering teams were eager to take over the monitoring process.
In the new model, the Manageability Platforms team’s service delivery focused on creating a baseline solution for the business app teams that included as much automation and as little administration as possible. The automation and self-service aspects of Azure toolset’s design made this possible, and most of our solution was based on out-of-the-box Azure tools and capabilities. We created a solution that made it easy for the business app teams to adopt and establish an Azure Monitor environment and begin realizing the benefits quickly.
At the same time, our centralized Manageability Platforms team had to undergo a cultural change too. We moved from a self-contained, service-provider model to a more dynamic, distributed consultant model. The Manageability Platforms team moved to working alongside the business app teams, helping them to understand and embrace the Azure Monitor solution while empowering them to take control and innovate within their own monitoring environment. We ran small-group sessions to help our business teams adopt Azure monitoring and provided individual assistance where requested or needed. Our team moved from being implementers to acting as enablers.
Establishing autonomy and alignment
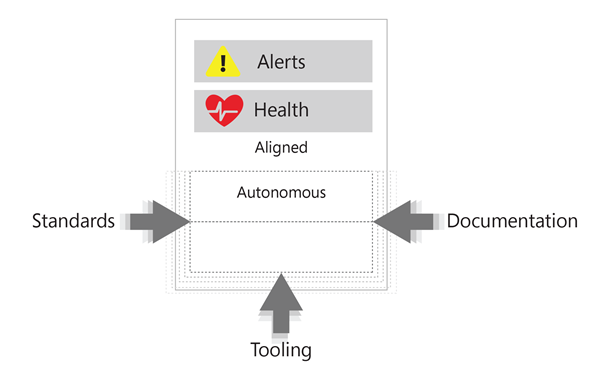
The autonomy that Azure Monitor allows provided enhanced capabilities for innovation and creativity for our business app teams. At the same time, we needed to establish standards and best practices for the monitoring environment to enable the DevOps teams to start with a baseline. However, Azure Monitor was so simple to use and implement that our business app teams were getting ahead of us—incorporating features that we hadn’t completely prepared for or implementing Azure Monitor components for workarounds or in nonstandard ways. We also needed to ensure we could view system health in a unified way, to assess and monitor the overall health of our environment and ensure that critical parts of that environment were monitored sufficiently.
We established several practices that helped align our business app teams’ work in Azure with the standards that the centralized Manageability Platforms team required to enable their global oversight.
- Standards. We established a set of general standards for creating and maintaining the Azure monitoring environment that we encouraged our business app teams to adopt. These were a baseline set of infrastructure alerts translated from preexisting SCOM alerts.
- Tooling. We used tooling to help our engineers create solutions in Azure that adhered to our standards and made it easier for our business app engineers to create a monitoring environment that met their needs. Our tooling most often included Azure Resource Manager templates, JSON configuration files, and Azure PowerShell scripts.
- Documentation. In tandem with the native Azure documentation, we created documentation that gave our business app teams guidance on how to use our toolkits and specific Azure features and components most effectively.
Establishing reporting and quality control with end-to-end monitoring
We combined Azure Monitor with Logic Apps and Microsoft PowerBI to provide an intuitive reporting and dashboard solution that fits the needs of almost all our business groups with minimal customization or modification. The combined toolset enables our business app engineers to dig deeply into their telemetry and create a complete view of end-to-end service health with the ability to drill down interactively into more granular views.
One of the biggest lessons we learned in creating our Azure Monitor environment was to design for reporting. We made sure that the way we created and configured our monitoring and alerting environment aligned with what we needed to see in the reports and dashboards that produced consumable and actionable results. For example, if the time it takes to back up a specific SQL Database directly affects the availability of an application using the database, we need monitoring and appropriate alerting configured in a standard way for each database so that we can report availability accurately in our dashboards. Standards, tooling, and documentation provided the guidance for this alignment.
Kusto Query Language in Azure Log Analytics and Application Insights allows our business app engineers to start query design quickly by using an easy-to-learn, standardized query language and get business-driven results. In Azure, dashboards are created in hours instead of weeks. Our app and service owners can create their own reporting and dashboarding solutions in PowerBI. They can create exactly what they need to see, and they no longer have to route all of their requests through a centralized reporting structure.
Azure’s scale and self-service capabilities have enabled us to retire all of the infrastructure dedicated to data warehousing and reporting. With PowerBI, reporting and dashboarding has been drastically improved. We’re not required to cache any data for reporting, and many reports are generated by using real-time data. Azure’s enterprise scale means that even our biggest queries and reports, those containing potentially billions of results, are returned quickly—often in minutes, instead of hours.
Our health dashboards in PowerBI allow our business app teams to connect business processes across subscriptions and otherwise disconnected components for clearer end-to-end visibility. Business app teams can also use the dashboards to identify dependencies and check for global availability.
Establishing an Azure monitoring solution
Although a significant amount of our effort in migrating to Azure Monitor was culturally focused, our technical implementation still provided core functionality that our business app teams required to create an end-to-end health monitoring solution for their environments.
Starting with the basics: The Alert Monitoring Toolkit
The Alert Monitoring Toolkit was an essential first step in our technical implementation. We created the Alert Monitoring Toolkit to enable our business group engineers to transition away from SCOM and create a monitoring environment in Azure Monitor quickly. The Alert Monitoring Toolkit automates the deployment of log alerts to Azure Monitor Log Analytics for core infrastructure components including infrastructure as a service (IaaS) virtual machines and SQL Servers. The toolkit consists of configuration files containing log alert definitions and an Azure PowerShell script that deploys the alerts. The toolkit is designed to enable our business app teams to easily create alerts in Azure Monitor that align with common SCOM alerts for virtual machine resources. We used the toolkit internally at Microsoft and published it on GitHub for our customers to use.
Understanding toolkit components
The toolkit is relatively simple. It has two major components: a JSON file containing a set of default alerts and a PowerShell script that automates the creation of those alerts. The toolkit allows us to address two important aspects of Azure Monitor adoption by our business groups:
- Provide a starting point for monitoring core app and service components. The toolkit creates alerts for core components that are common to most app and service environments so that whoever is using the toolkit doesn’t have to locate monitors and dependencies for basic components. These alerts include:
- Core infrastructure alerts such as high CPU usage, low disk space, low memory, and unexpected shutdown.
- Core SQL Server alerts including failed recovery, resource errors, key constraints, and transaction errors.
- Simple Network Management Protocol (SNMP) traps for hardware issues such as fan failure and drive array degradation.
- Events for major Windows components including Group Policy, Failover Clustering, Hyper-V, and Desired State Configuration.
- Create standards and baselines for alert configuration. The JSON configuration file contains definitions for standard thresholds to ensure a minimum level of monitoring for whoever uses it. The PowerShell script created alerts by using best practices for monitoring, and it ensures that the proper connection between Azure resources is established. The toolkit creates several components that work together to create alerts:
- Action group. The action group contains any number of actions that should happen after the alert fires, including notifications via webhook, email, SMS, ITSM systems, or push notifications to the Azure Mobile App. It also includes actions to programmatically fix issues via Azure Logic Apps, Functions, and Runbooks.
- Saved search. The saved search is where the alert query is defined.
- Schedule. A saved search can have one or more schedules. The schedule defines how often the search is run and the time interval over which the criteria is identified.
- Alert action. The alert action is associated with the saved search, schedule, and action group to create the final alert.
Onboarding IaaS virtual machines
Core IaaS components are easily onboarded by using the toolkit. The process our business groups used varied from group to group, but the general process was:
- Provision a Log Analytics workspace.
- Install the Log Analytics Agent on IaaS virtual machines.
- Modify the toolkit configuration file to define additional monitors and alerts, if desired.
- Use the toolkit script to import basic monitors.
- Customize alerts to perform actions that are appropriate to your environment, such as email notifications.
The toolkit provides the means to rapidly configure core monitoring in Azure Monitor. However, users can further customize the environment by leveraging machine-learning-based techniques on operational data within Azure Monitor to set up alert rules by using Dynamic Thresholds (in preview) without worrying about the correct threshold to trigger an alert. Users can also automatically group together related alerts using Smart Groups (in preview) for faster troubleshooting.
Going deeper: Adopting Azure Monitor at Microsoft Sales and Marketing
Our Sales and Marketing business group provides an excellent example of how the transformation process from SCOM to Azure went for many Microsoft business groups. The Commercial Sales and Marketing Engineering (CSME) team supports approximately 50 distinct services and more than 140 apps for their organization, ranging from customer engagement to lead qualification to marketing events. The group moved its entire monitoring environment from a hosted service in SCOM to a DevOps-driven Azure Monitor is a little less than one year.
When engaging with CSME, our team approached the transformation with culture and process at the top of our priority list. We understood the need to reevaluate the CSME app and service environment in the context of DevOps and Azure Monitor. Our process involved five phases:
- Create a taxonomy to define the app and service environment.
- Set minimum-bar monitoring and alert standards.
- Establish core data-driven measures.
- Create and execute a playbook to define the Azure Monitor adoption process.
- Track and measure the Azure Monitor environment to drive standards and governance.
Creating a common language with taxonomy
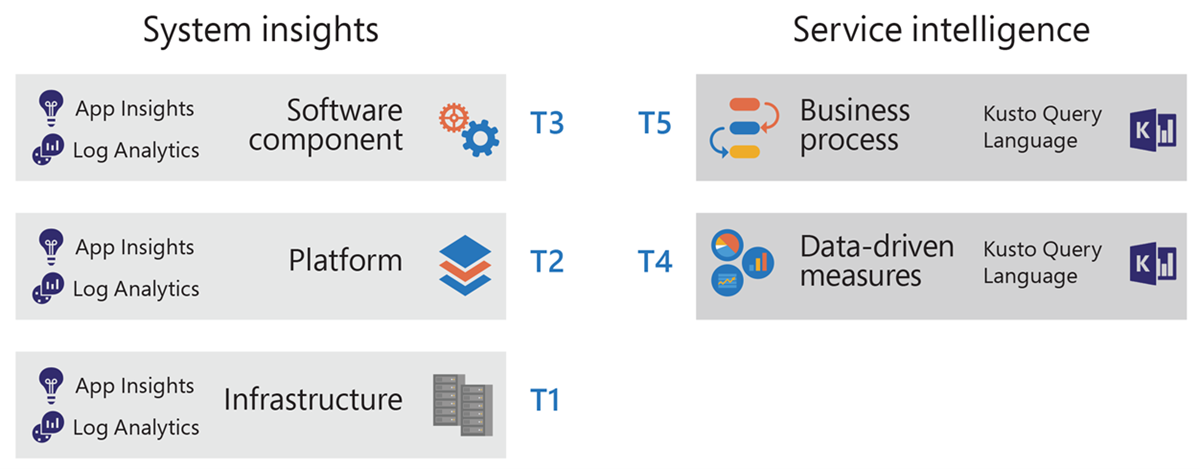
Establishing a taxonomy helped us communicate the core components of our app and service environment to the service engineers who were becoming responsible for them and explain how they related to monitoring and alerting. We grouped monitoring and alerting into two scopes that defined the key information from both sides of the individual business solution being monitored. We established five tiers within those scopes that delineated individual solution components to be measured.
System insights scope
The System insights scope covers application and infrastructure components that include diagnostics, metrics, threshold alerts, and Azure instrumentation in App Insights and Log Analytics for the first three monitoring and alert tiers:
- Tier 1: Infrastructure. This tier includes core infrastructure components like operating system, SQL Server, memory disk, and CPU components.
- Tier 2: Platform. This tier examines specific platforms such as Microsoft Azure SQL, Dynamics CRM, or WebApp.
- Tier 3: Software component. This tier monitors more specific component functionality relating to a single application, such as database, website, or service function.
Service intelligence scope
The service intelligence scope focuses on data and business-related functions. It includes higher-level monitoring including service options, correlated events, business rules, and standard data contracts in two tiers:
- Tier 4: Data-driven measures. Data-driven measures focus on the purpose of an app or service and whether the purpose is being fulfilled. This tier includes queue size and data freshness timing.
- Tier 5: Business process. This tier includes tracking individual business processes from start to finish such as lead tracking or flow timing.
Setting a minimum bar for monitoring and alert standards
One key implementation task was setting monitoring alert standards and then communicating what we wanted to monitor and how. We approached the process by examining our existing SCOM environment, performing a comprehensive review of our environment, reviewing available Azure Monitoring capabilities, and identifying how those monitors would apply to the CSME environment.
Examining SCOM monitors and alerts
We examined our SCOM management pack configuration and the monitors and alerts it contained. For those apps and services with IaaS components, we were able to quickly create a monitoring environment in Azure by using the Alert Monitoring Toolkit. For most applications and services, we moved to a complete review of the app and service environment to capture a better understanding of how we could best configure Azure Monitor to meet business needs.
Reviewing the CSME app and service environment
A complete review of the CSME app and service environment gave us the opportunity to identify all components in the environment, who owned the component, and what aspects of the component we needed to monitor. We went through the Azure catalog, identified the Azure services we used, and set minimum-bar standards for each service. At the same time, we performed a comprehensive review of monitors available in Azure Monitor to get a complete picture of monitoring and alerting capabilities. We mapped our service catalog to a PowerBI report to identify all of the components. Our component owners reported the appropriate information for their app or service and we consolidated the results, using our taxonomy to group monitors and alerts. We defined the appropriate thresholds and severity levels for each alert. Some of these standards were already defined and in place as part of the Alert Monitoring toolkit. We created the others based on input from the component owners and how they needed to understand the behavior of their app or service.
Leveraging Failure Mode and Effects Analysis
Beyond the minimum requirements, Failure Modes and Effects Analysis (FMEA) was a big part of the initial assessment of the standards-setting process. We leveraged industry practices around FMEA to help our service engineers determine their own monitoring needs. Using FMEA, service engineers learned to examine their own environment and identify all app and service components and the possible ways they could fail. The process consisted of four major phases:
- Map business processes to understand core business functionality.
- Define the service-level objectives and health measures to include.
- Build and assess a fault tree to understand methods and modes for potential failures.
- Quantify risks to establish value and hierarchy.
The FMEA process helped teams quantify the failure risks for different components and prioritize the correct monitoring to mitigate the risks.
Establishing core data-driven measures
Core data-driven measures help to define the functional health of our applications and services over and above their component status. We use these measures to define quality of service for each app or service in environment. Our engineers were required to submit queries aligned with our minimum bar standards that provided accurate information for three key measures:
- Availability. These relate to successful availability tests completed with expected results. When measuring availability, we ask our engineers to:
- Test all customer-facing endpoints.
- Use synthetic transactions, such as ping or http, rather than actual user sessions.
- Test from a minimum of five locations.
- Test with a frequency of 15 minutes or less.
- Reliability. These contain measures of transactions completed with expected results. When measuring reliability, we ask our engineers to:
- Measure actual user transactions.
- Measure only completed transactions.
- Do not include synthetic test transactions.
- Measure only final results.
- Performance. These contains the results of the reliability measures compared to expected service level agreement (SLA) results.
These measures are based on tier 3 and tier 4 of our taxonomy classification and when combined, they provide a quality-of-service health view for the entire app and service portfolio.
Defining the adoption process with a playbook
Our Azure Monitor playbook gave our engineers everything they needed to create their monitoring environment in Azure Monitor and start using it to monitor their app environments. The playbook included all the necessary steps.
- Set up monitoring infrastructure in Azure. This step involved preparing the core Azure components required.
- Create and configure Log Analytics and App Insights environments.
- Install the Log Analytics Agent for any IaaS virtual machines.
- Run the Alert Monitoring Toolkit.
- Onboard apps and services. In this step, our CSME app owners performed a series of tasks to create a set of monitors and alerts that met our minimum-bar standards.
- For each component, ensure that monitors and alerts are created that cover tiers 1 through 3 in the minimum-bar standards.
- Create core quality-of-service monitors and alerts.
- Add additional data-driven measures and monitors as necessary.
- Report solution health and align to CSME standards. Our app owners were responsible for monitoring their app or service health and onboarding the app or service to the CSME quality-of-service dashboard. This dashboard was used to track overall CSME app and service health. We also used a PowerBI dashboard to track the onboarding process.
After our app owners aligned their reporting to our standards, we were able to use a PowerBI dashboard to track the implementation of Azure Monitor across our apps and services. As minimum-bar standards were put in place for each app or service, we could track overall status and where app or service owners had not put these standards in place.
Empowering our engineers to build their monitoring skillset
The playbook also included important information about building a monitoring environment that generates accurate and effective information. We provided information that directed our engineers to:
- Make alerts actionable. If an alert is triggered, it should require that someone address the issue. Leave informational events for reporting only.
- Test alert scenarios by connecting to non-production instances or setting very high or very low thresholds.
- Alert on aggregated data and derived events, not on raw instrumentation.
- Use self-healing in alert configuration.
- Consider redundancies and report on app and business-centered scenarios, not just performance data.
Tracking and measuring the environment to drive standards and governance
Moving forward with the Azure Monitor environment as a business group meant continuing to ensure our apps and services were given full monitoring coverage. We used a set of dashboards in PowerBI to track and measure how our engineers were reporting their app and service behavior. The focus of our dashboards is on ensuring minimum-bar standards, and capturing complete and accurate quality of service information for each app or service. Our dashboards monitor each application in our service catalog to provide important standards and governance related views including:
- Monitoring readiness. This view indicates which steps in the onboarding process each app or service component has completed.
- Measure reference. This view contains a reference for each core standards measure per tier in the taxonomy, based on platform, resource, metric, and alert levels.
- Monitoring tier coverage. This view indicates whether or not adequate monitoring coverage for each app or service has been established in each of the taxonomy tiers, according to the process dictated by the playbook.
In addition, the quality of service dashboard provides app and service-level information on availability, reliability, and performance data for all CSME apps and services. These combined dashboards enable us to continue monitoring our monitoring environment to ensure compliance with standards.
Driving efficiency with continuous refinement
A significant effect of using the DevOps model is the impact on the CSME engineers and how they maintain their monitoring environments. Now alerts and tickets are managed by the CSME engineers who support and maintain the application. This increases responsiveness in two areas:
- App issues are resolved more efficiently. When engineers receive an alert regarding app health, they are able to take action and resolve the issue immediately. Because notifications no longer go to the service desk but instead to the app team, a frequently occurring alert inconveniences the app team. This prompts them to address the alert quickly and fix the problem efficiently so that the alert doesn’t occur in the future.
- Monitors and alerts are configured more accurately. The app engineers know their apps best. They configure the thresholds for their monitors and alerts at an optimal level. If those thresholds need to be changed, or cause unnecessary alerts and notifications, the app engineers know immediately and can reconfigure the appropriate components within the monitoring solution, such as adjusting thresholds, or changing notification configuration.
This environment creates a cycle of continuous improvement within Azure Monitor and the monitored apps and services. For example, if Azure Monitor is repeatedly sending alerts to an engineer about a database throughput unit (DTU) threshold for an Azure SQL instance, the engineer will work to resolve the performance issue in Azure SQL. Or, if the threshold needs to be changed, the engineer will modify the alert so that it isn’t creating unnecessary notifications. Because our CSME engineers are consuming what they create, they are continually innovating and building a more efficient, more dynamic solution for themselves.
Best practices and lessons learned
- Consider cultural impact. Culture was the biggest factor in our migration process. The shift from centralized to DevOps is a significant change for most organizations, and it works better to obtain leadership buy-in early.
- Balance innovation with alignment. Although Azure provides your app owners with the freedom to innovate, be sure to balance innovation with alignment. Automation and standard toolkits provide suitable methods to enable standardized and common usage, while documentation and education ensure that expectations are known across the organization.
- Leverage autonomy for innovation. Your app owners have the opportunity in Azure to build their monitoring and alerting environment to their exact specifications. Ensure that proper planning and due diligence are observed when planning and creating each environment. Then empower app owners to innovate.
- Develop a method to map to your service catalog. It’s important to use existing catalogs and definitions of your app and service environment to make it easier to identify apps and services and ensure a comprehensive inventory of the app and service environment.
- Consume what you create. In the DevOps model, service engineers are responsible for their own monitoring, and we require them to respond to their own alerts. This process ensures that service engineers are always aware of exactly how the monitoring environment is performing. If alert quality isn’t up to standard or alerts are generating too much notification noise, service engineers will address the issue because they consume the alerts. It creates a cycle of continuous improvement.
Benefits
- Increased monitoring agility and relevance. Our engineers create monitors and alerts in minutes with Azure Monitor. With SCOM, it took several days of undergoing due process between the business app engineers and the Manageability Platforms team before an appropriately configured monitor or alert was created. Changing a monitor or alert involved the same process. Our engineers also create their own dashboards and reports in a fraction of time it took using SCOM—hours instead of weeks. Our business app engineers simply create what they want to see by using Log Analytics and PowerBI instead of the SCOM method: coordinating with Manageability Platforms, explaining the reporting or dashboard need, and waiting until the Manageability Platforms team created the dashboard or report. Our Azure Monitor environment is always at pace with our app environment, and it’s always relevant.
- End-to-end service health. Azure Monitor provides a complete and consolidated view of our environment, and it does the same for each of our business app teams. The reporting and dashboard tools make it easy to provide concise, targeted information about any part of the environment.
- More innovation and better alignment with DevOps culture. Our business app teams are empowered to create an environment that fits their solutions and aligns with the way that they’re developing and managing their solutions. Because our engineers are receiving the alerts from their apps and services, they are more motivated to not only fix the issue with the app but also to configure the monitoring environment as efficiently as possible. As a result, our business is more agile and better performing.
- Reduction in major incidents. The dynamic management that our business app teams perform on their monitoring and alerting creates a more closely watched environment. This in turn leads to quicker fixes, better apps, reduced major incidents, and higher levels of performance and efficiency from our systems. Our capability to auto-detect incidents reduced our user-reported incidents by more than 50 percent. We reduced our number of undetected incidents to almost zero with Azure Monitor.
- Reduced maintenance. We no longer have to maintain a SCOM infrastructure. This allows us to focus on the application being monitored instead of managing infrastructure. Our engineers can assist our business teams to continuously improve monitoring and create business benefits.
- Infrastructure cost savings. Migrating monitoring and alerting to Azure has allowed us to fully decommission our centralized SCOM infrastructure and operations resources, leading to significant capital expense savings and a more predictable operational expense in Azure.
Going forward
At Microsoft, moving to Azure Monitor has created a monitoring environment that aligns with our DevOps culture and empowers our business app engineers to improve their environments and create business benefit. The Manageability Platforms team is continuously refining and improving how we’re using Azure Monitor and how we’re providing guidance to our business app engineers on using Azure Monitor.
We’re working on incorporating new Azure and Azure Monitor features into our environment including multi-resource metric alerts, which allow us to create a single alert to monitor multiple virtual machines in a subscription. We’re also working toward incorporating Azure Policy into our standards and governance scenarios to enforce compliance.