
This research paper was presented at the 17th European Conference on Symbolic and Quantitative Approaches to Reasoning with Uncertainty (opens in new tab), a premier forum for advances in the theory and practice of reasoning under uncertainty.

In the field of reasoning under uncertainty, probabilistic graphical models (PGMs) stand out as a powerful tool for analyzing data. They can represent relationships between features and learn underlying distributions that model functional dependencies between them. Learning, inference, and sampling are operations that make graphical models useful for domain exploration.
In a broad sense, learning involves fitting the distribution function parameters from data, and inference is the procedure of answering queries in the form of conditional distributions with one or more observed variables. Sampling entails the ability to extract samples from the underlying distribution as defined by the graphical model. A common challenge with graphical model representations lies in the high computational complexity of one or more of these operations.
Various graphical models impose restrictions on the set of distributions or types of variables in the domain. Some graphical models work with continuous variables only (or categorical variables only) or place restrictions on the graph structure, for example, the constraint that continuous variables cannot be parents of categorical variables in a directed acyclic graph (DAG). Other restrictions affect the set of distributions the models can represent, for example, only multivariate Gaussian distributions.
PODCAST SERIES

AI Testing and Evaluation: Learnings from Science and Industry
Discover how Microsoft is learning from other domains to advance evaluation and testing as a pillar of AI governance.
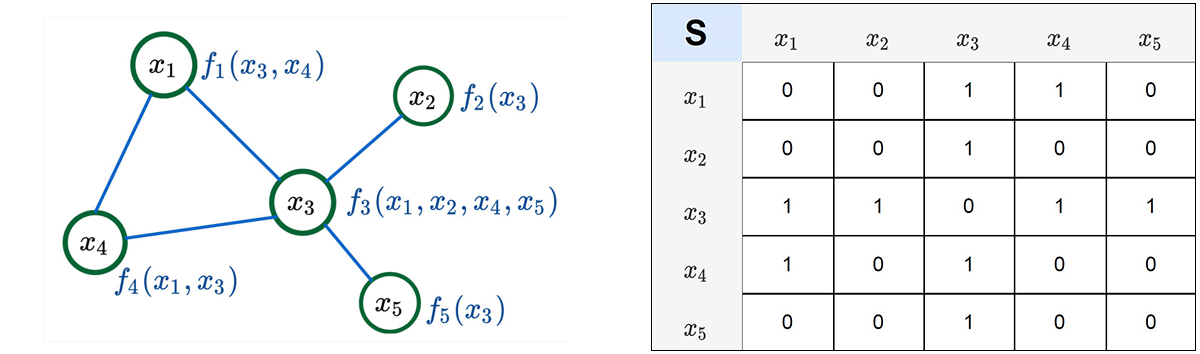
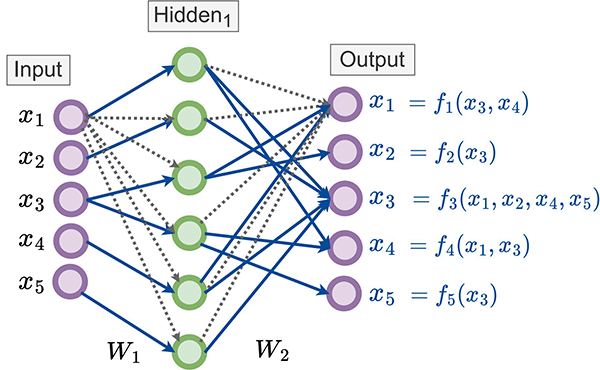
In our paper, “Neural Graphical Models,” presented at ECSQARU 2023 (opens in new tab), we propose Neural Graphical Models (NGMs), a new type of PGM that learns to represent the probability function over the domain using a deep neural network. The parameterization of such a network can be learned from data efficiently, with a loss function that jointly optimizes adherence to the dependency structure, given as input in the form of a directed or undirected graph, and fit to the data. Probability functions represented by NGMs are unrestricted by any of the common restrictions inherent in other PGMs. NGMs can handle various input types: categorical, continuous, images and embedding representations. They also support efficient inference and sampling.
Experimental validations for NGMs
In our paper, we evaluate NGMs’ performance, inference accuracy, sensitivity to the input graph, and ability to recover the input dependency structure when trained on both real and synthetic data: Infant mortality data (opens in new tab) from the Centers for Disease Control and Prevention (CDC), synthetic Gaussian Graphical model data, and lung cancer data from Kaggle.
The infant mortality dataset (opens in new tab) describes pregnancy and birth variables for all live births in the US and, in instances of infant death before the first birthday, the cause of death. We used the latest available data, which includes information about 3,988,733 live births in the US during 2015. It was particularly challenging to evaluate the inference accuracy of NGMs using this dataset due to the (thankfully) rare occurrence of infant deaths during the first year of life, making queries concerning such low probability events hard to accurately estimate.
We used the CDC data to evaluate the NGMs’ inference accuracy. We compared their prediction for four variables of various types: gestational age (ordinal, expressed in weeks), birth weight (continuous, specified in grams), survival until the first birthday (binary) and the cause of death. We used the categories of “alive,” the 10 most common causes of death, or “other” for the less common causes. Here, “alive” was indicated for 99.48% of infants. We also compared the performance of logistic regression, Bayesian networks, Explainable Boosting Machines (EBM), and NGMs. In case of NGMs, we trained two models: one using the Bayesian network graph and one using the uGLAD graph.
Our results demonstrate that NGM are significantly more accurate than logistic regression, more accurate than Bayesian networks, and on par with EBM models for categorical and ordinal variables. They particularly shine when predicting very low probability categories for multi-valued variable cause of death, where, in contrast most models (such as both PGMs and classification models) typically struggle. Note that while we need to train a separate LR and EBM model for each outcome variable evaluated, all variables can be predicted within one trained NGM model. Interestingly, the two NGM models show similar accuracy results despite the differences in the two dependency structures used in training.
We believe that NGMs are an interesting amalgam of the deep learning architectures’ expressivity, and PGMs’ representation capabilities and can be applied in many domains, given that they place no restrictions on input types and distributions. We encourage you to explore NGMs and take advantage of the ability to work with a wider range of distributions and inputs. You can access the code for Neural Graphical Models on GitHub (opens in new tab).