

You have a great idea you want to evaluate for your product through an A/B test. You formulate your hypothesis, set up the engineering pipeline for the test and follow the pre-experiment trustworthy patterns we described in the first part of our trustworthiness series. Then, you start your A/B test and wait for it to conclude. In the meantime, what analyses can you perform to get actionable insights as the test runs and how do you ensure you are making trustworthy conclusions from your analysis?
In this blog post and second part in our Patterns of Trustworthy Experimentation series, we cover the during-experiment stage and discuss which metrics to check and analyses to perform to gain insights from your A/B test while it is running. While many of these patterns are also applicable in the post-experiment stage – which we will cover in the last installment of our series – they are particularly relevant to catch unintended regressions in the user experience and avoid misinterpreting early results.
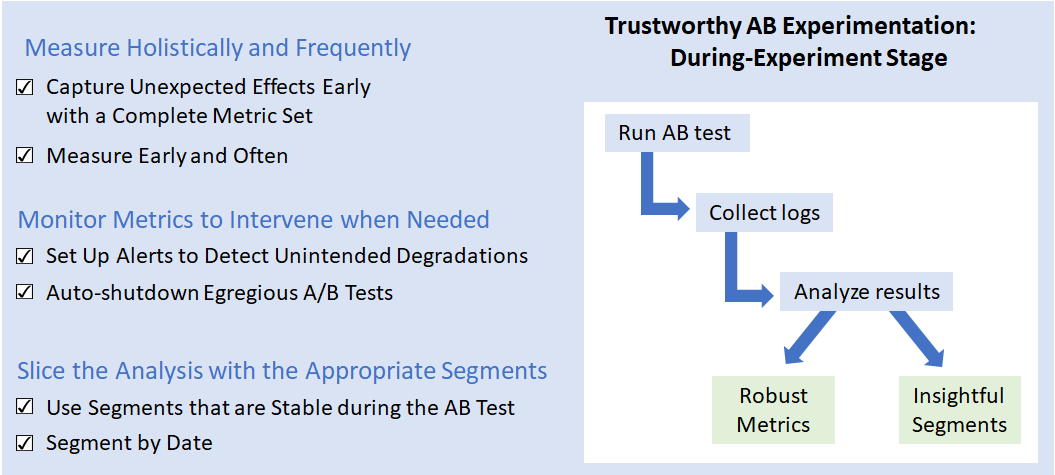
Trustworthy analysis requires well-designed metrics and reliable segments. We group them into 3 main patterns as shown the figure below: Measuring holistically and frequently, monitoring metrics to intervene when needed, and slicing the analysis by the appropriate segments. We start with describing how a trustworthy metric set can help identify issues early in the A/B test.
During-Experiment Trustworthiness Patterns
Measure Holistically and Frequently
“Getting numbers is easy; getting numbers you trust is hard” [1]. When running your A/B test, measuring the impact of the change correctly is essential to identify the next step after the test. A/B metrics should be Sensitive, Trustworthy, Efficient, Debuggable, and Interpretable (STEDI) [2] to allow the experimenter to properly understand the treatment effect and interpret the metric movements observed. Below, we describe two aspects to increase the trustworthiness of metrics and A/B tests: a holistic metric taxonomy and frequent metric computation during the test.
Capture Unexpected Effects Early with a Complete Metric Set
It’s not uncommon for product changes to result in improvements in some aspects and unintended regressions in others. Hence it is important to analyze each A/B test with a rich metric set that covers (almost) all aspects of the product to identify them. To make a correct ship decision, we need to properly tradeoff the improvements against the regressions observed. These tradeoffs play out with a wide variety of changes: a more engaging feature vs dropped engagement in other regions of the product, increased exploration due to more relevant item recommendations versus higher dropout rates in checkout completion, or richer content displayed versus longer load times. From our experience at Microsoft [3][4] and building on published work [5][4], we recommend that partners follow a holistic metric taxonomy that we summarize in the table below. This taxonomy is helpful in guiding the metric design process as well as interpreting the results of the test.
| Type | Description | Examples |
|---|---|---|
| Data Quality Metrics | Capture telemetry inconsistencies in features and determine whether we can trust the rest of the metrics | Error Rates, Data Loss Rates, Join Rates, Sample Ratio Mismatch (SRM) |
| Overall Evaluation Criteria (OEC) Metrics | Capture the overall goal the product optimizes towards, typically reflects user satisfaction or loyalty | Session Count, Session Success Rate, Utility Rate [6] |
| Local Feature and Diagnostic Metrics | Measure the usage and functionality of individual features of a product and help interpret OEC metrics movements | Feature Coverage, Click Through Rate, Messages Received |
| Guardrail Metrics | Measure aspects of the product that we don’t want to degrade but won’t necessarily improve | Page Load Time, Crash Rate, Abandonment Rate |
Measure Early and Often
While the duration of an A/B test is pre-set before it starts, we recommend that feature crews check-in on the impact of the change throughout the test. At Microsoft, the typical duration of an A/B test is 7 days, and in that period, we compute metrics at regular intervals to assess the effect of the treatment and catch any unintended consequences. In fact, we encourage ExP’s customers to set up near-real time measurement and compute a small but critical set of metrics as soon as the test starts. This significantly increases the chances of detecting any issues, bugs or regressions in the user experience early on.
By computing metrics early and often, feature crews can make fast decisions about treatments that deliver clear benefits to the user and stop others that have unexpected issues. The choice of which metrics to compute depends on few characteristics: their computation efficiency, their importance to the product and their sensitivity to detect changes early on. Note that with these repeated measurements throughout the test, we need to account for multiple hypothesis testing and early peeking in our statistical methods [7][8][9]. At ExP, to make early results more trustworthy, we require stronger statistical significance levels and in the absence of highly certain metric movements, we recommend running the test until the end of its pre-determined duration and adopt the metric movements observed then.
Monitor Metrics to Intervene when Needed
As described in the previous section, it is essential to measure throughout the A/B test to avoid running blind until the pre-determined duration ends. However, as teams run more and more A/B tests, and many metrics get computed during the test, it is hard to inspect all these metrics individually and react to any major degradation quickly. Setting up automated reactions increases the trust of feature crews in the testing platform as they scale their experiment count.
Set Up Alerts to Detect Unintended Degradations
With the scale of A/B tests run at Microsoft (even within one product), alerting for major metric movements and automatically notifying the feature crews about them helps in identifying the A/B tests that require attention or investigation early on. At ExP, we recommend that a feature crew set up alerts for their business-critical metrics: Guardrails (e.g. page load time, error rates) and OECs (e.g. user satisfaction metrics). These alerts can be triggered if a large movement is detected and/or if the p-value dips below a specific threshold.
One of the main metrics to set alerts on are Sample Ratio Mismatches (SRMs) . SRMs occur when the number of users in treatment and control are not balanced and their ratio doesn’t satisfy the expected ratio. SRMs typically invalidate the A/B test and make any results and metric movements untrustworthy. Hence, it’s essential to have SRMs tested early and have alerts set up if one is detected. This way, the feature teams can investigate the SRM and end the A/B test early if the results are not salvageable.
Auto-Shutdown Egregious A/B Tests
In the pre-experiment trustworthiness patterns blog post, we recommend enabling safe rollouts to detect any issues or bugs that would have slipped past our quality control process for an A/B test. When we detect such an egregious A/B test, whether through inspecting metrics during or through alerts we set up, it might take some time for the feature crew to react and stop the A/B test. Setting up auto-shutdown for A/B tests that significantly degrade the product or the user experience will resolve issues as soon as they are detected, instead of relying on (a possibly delayed) manual intervention. Such auto-shutdowns have been enacted when a bug was inadvertently introduced in a Bing A/B test that led to a 404 page. By intervening quickly, we saved the user (and product) from an egregious test with unintended consequences.
Slice the Analysis with the Appropriate Segments
Treatments affect users differently depending on their characteristics. For example, a search engine feature that shows 4th of July recipes will have a smaller impact on users in France compared to users in the US. To ensure that we evaluate the change correctly, we segment the population along the different user characteristics and compute the full metric set for each segment. This allows us to catch any heterogeneous treatment effects, ship the change to some segments but not others, and better understand the needs and issues faced by the various segments. In the next section, we describe two segments that (i) increase the trustworthiness of the analysis by reducing noise or (ii) identify hidden effects by slicing along the duration of the A/B test.
Use Segments that are Stable during the A/B Test
At ExP, we recommend “static” segments that rarely get affected by treatment, where the user remains in the same segment value throughout the A/B test. Some standard segments used by ExP customers are: Market, Country, Browser, App version, user activity before the start of the A/B test, etc. When defining segments for a product, it is important for the segment sizes to be balanced between treatment and control as to not cause an SRM for a particular value of the segment. Static segments satisfy that property since the membership of a user in a segment is determined independent of the treatment, and as long as the overall test doesn’t have an SRM, each segment slide will be SRM-free. Segments that do get affected by treatments like user activity are “dynamic”, in the sense that users can flip from one segment value to another during the test. One example is segmentation based on the number of active days of the user: if the treatment causes engagement to increase, a user’s active days may also increase, thus landing them in a different segment value. Inspecting segments during the A/B test to make sure they are stable and have no SRMs guarantees that any early insights based on segment analysis are trustworthy and actionable.
Note: In cases where we want to slice users by dynamic segments, we recommend that teams build weighted metrics that focus on that segment. We describe weighted metrics and how to make them trustworthy in the upcoming third part of our series.
Segment by Date
Treatment effects can change as the A/B test runs due to a couple reasons: users’ reactions to a change can increase or decrease over time, and day-of-the-week effects can affect the applicability of the change. Looking at analysis results in the early stages of the test can bias the feature crews towards changes that have only a temporary improvement to the product. Microsoft News once replaced the Outlook button with the Mail app button on homepage [3]. The result seemed inviting as we saw a 28% increase in the number of clicks on the Mail button. This was a surprising result with large increase in user engagement. Can we trust this result and start celebrating?
Twyman’s law [10] dictated that we look deeper. We usually compute the metric set segmented by each date in the test’s period. We found that the number of clicks on the mail app button were decreasing rapidly day over day (Figure 2). This was evidence of a novelty effect where users were getting confused and clicking repeatedly on the button [3]. Looking at date segments prevented us from shipping a change that has diminishing and non-lasting returns. Similar use of date segments has also been reported by LinkedIn [11].
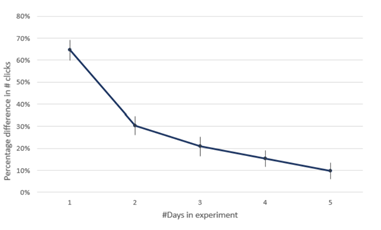
Percentage difference in #Click between the Outlook.com button and Mail App button as the A/B test progresses.
At ExP, we recommend segmenting every A/B test analysis by date. Rapid decline of estimated treatment effect across date segments of an A/B test is an indicator of novelty effect. A treatment effect that is different at the beginning of the test compared to the end, is an indicator of change in the product or environment interacting with the treatment. If the treatment effect spikes on a single day then it may indicate a data quality issue or a short-term or seasonal factor (like a sports event, holiday, or a shopping event) that has interacted with the treatment. Since these events are not likely to happen every few weeks, the estimated average treatment effect is unlikely to generalize outside of the test’s period.
Summary
Trustworthy A/B testing requires holistic and frequent measurement and detailed segmentation: metrics that cover all aspects of the product and user behavior, automated reactions to unintended consequences and, stable insightful segments. These patterns ensure we don’t miss any unintended consequences and greatly improve the trustworthiness of the results.
In the last installment of our series, we will cover the post-experiment stage and discuss patterns that, when applied, will increase the trustworthiness of your A/B tests and experimentation platform as a whole.
– Widad Machmouchi, Somit Gupta and Ruhan Zhang, Microsoft Experimentation Platform
References
[1] R. Kohavi, D. Tang, and Y. Xu, Trustworthy Online Controlled Experiments: A Practical Guide to A/B Testing. Cambridge University Press.
[2] S. Gupta, X. Shi, P. Dmitriev, X. Fu, and A. Mukherjee, “Challenges, best practices and pitfalls in evaluating results of online controlled experiments,” in WSDM 2020 – Proceedings of the 13th International Conference on Web Search and Data Mining, Jan. 2020, pp. 877–880, doi: 10.1145/3336191.3371871.
[3] P. Dmitriev, S. Gupta, D. W. Kim, and G. Vaz, “A Dirty Dozen: Twelve common metric interpretation pitfalls in online controlled experiments,” in Proceedings of the ACM SIGKDD International Conference on Knowledge Discovery and Data Mining, 2017, vol. Part F1296, pp. 1427–1436, doi: 10.1145/3097983.3098024.
[4] W. Machmouchi and G. Buscher, “Principles for the design of online A/B metrics,” SIGIR 2016 – Proc. 39th Int. ACM SIGIR Conf. Res. Dev. Inf. Retr., pp. 589–590, 2016, doi: 10.1145/2911451.2926731.
[5] K. Rodden, H. Hutchinson, and X. Fu, “Measuring the User Experience on a Large Scale : User-Centered Metrics for Web Applications,” Proc. SIGCHI Conf. Hum. Factors Comput. Syst., pp. 2395–2398, 2010, doi: 10.1145/1753326.1753687.
[6] W. Machmouchi, A. H. Awadallah, I. Zitouni, and G. Buscher, “Beyond success rate: Utility as a search quality metric for online experiments,” in International Conference on Information and Knowledge Management, Proceedings, 2017, vol. Part F1318, doi: 10.1145/3132847.3132850.
[7] E. Kharitonov, A. Vorobev, C. Macdonald, P. Serdyukov, and I. Ounis, “Sequential Testing for Early Stopping of Online Experiments,” Aug. 2015, doi: 10.1145/2766462.2767729.
[8] A. Malek, S. Katariya, Y. Chow, and M. Ghavamzadeh, “Sequential multiple hypothesis testing with type I error control,” 2017.
[9] D. J. Benjamin et al., “Redefine statistical significance,” Nature Human Behaviour, vol. 2, no. 1. 2018, doi: 10.1038/s41562-017-0189-z.
[10] R. Kohavi, “Twyman’s Law.” .
[11] N. Chen, M. Liu, and Y. Xu, “How A/B tests could go wrong: Automatic diagnosis of invalid online experiments,” WSDM 2019 – Proc. 12th ACM Int. Conf. Web Search Data Min., pp. 501–509, 2019, doi: 10.1145/3289600.3291000.