

“When I think about digital transformation now, I break it into two things. I think about resilience and what Microsoft can do to help any business be more resilient”
—Satya Nadella, Microsoft Q4 2020 Earnings Call
The concept of organizational resilience can be used to explain why some organizations succeed while others fail in times of change. Every organization has limits beyond which it ceases to operate effectively. When emerging crises push organizations beyond these limits, there is immense pressure to adapt to the new environment – and quickly. Organizations that fail to adapt may no longer be able to achieve their purpose, return a profit, or justify their continued existence.
Business closures at the onset of the Covid-19 pandemic are a stark illustration of how many organizations operate at the limits of their capacity, even in normal times. Under sustained pressure, even the best organizations may be pushed to their limits. How can we help organizations to understand their capacity for resilience before it is needed, and how can we help them to increase that capacity before it is too late?
One important step is digital transformation. All the forces driving this cross-industry process have been multiplied by the pandemic, and Microsoft has published a playbook (opens in new tab) for accelerating the kind of digital transformation that facilitates business resilience. But what does a “digitally transformed” organization look like, how does it operate over time, and how can we identify behaviors that represent both resilience and rigidity in the face of threats?
Organizational network analysis
For several years, we have been working with the Microsoft Workplace Analytics (WPA) team to explore how advances in graph statistics could be applied to Organizational Network Analysis (ONA), as well as how such network analysis could reveal insights about how work actually gets done in practice. This can be quite different to how work is organized “in theory” as represented by formal org charts, and the degree of alignment can vary dramatically both across different parts of the organization and over time.
Our initial explorations focused on the use of network visualization to map out the structure of organizations based on pairwise collaboration between individuals, inferred from shared activity across Outlook and Teams (e.g., email or message exchange; shared meetings or channels). We were interested in the identification of workgroups that reveal the organic, emergent, and informal organization of work. Using network community detection algorithms to infer the hierarchical structure of these collaboration networks, we were able to provide a contrasting model of organization to the hierarchical reporting structures of org charts.

These workgroup maps gave us something tangible to share with company executives as offering new perspectives on their own organizations. They allowed vague concepts like “siloed” and “stretched” to become self-evident in the visual structure of workgroups, but also raised several important questions: How well do workgroups align with reporting hierarchies? How much do workgroups vary their patterns of collaboration over time? And how can we measure and visualize these qualities as a way to understand the culture of collaboration across an organization?
Workgroup mapping
Our workgroup mapping paper describes how we answered these questions using two new metrics, representing (1) the “freedom” of workgroups to collaborate across organizational boundaries, and (2) the “fluidity” of workgroup relationships over time. To date, we have used these metrics (and accompanying presentation generating pipeline) to share collaboration insights with the leaders of hundreds of major companies who have provided their tenant data for this purpose.
When the Covid-19 pandemic struck, we turned our attention to how such collaboration metrics might be used as a barometer of organizational health over time – revealing how organizations responded to the unprecedented shock and its enduring consequences for the practice of work. For those organizations who were able to transition to home working, the signals from communication and collaboration software would, for the first time, capture all interactions in their new, virtual, and “digitally transformed” workplaces. What could this tell us about the response of our own organization, our customer organizations, and the industries that we serve? And what do different levels of collaboration metrics across workgroups tell us about the resilience of the broader organization?
Organizational resilience
Our toward resilience (opens in new tab) and uncovering resilience (opens in new tab) articles describe our process of deriving new collaboration metrics that would allow us to understand the impact of the pandemic on our own organization, Microsoft. For example, we define “churn” as the proportion of collaborative relationships from one period that are lost in the following period. If we align these periods either side of a disruptive event (such as a pandemic passing its tipping point), we might expect to more resilient organizations experience less churn. Indeed, this is what we observed in general for Microsoft – but that’s not the whole story.
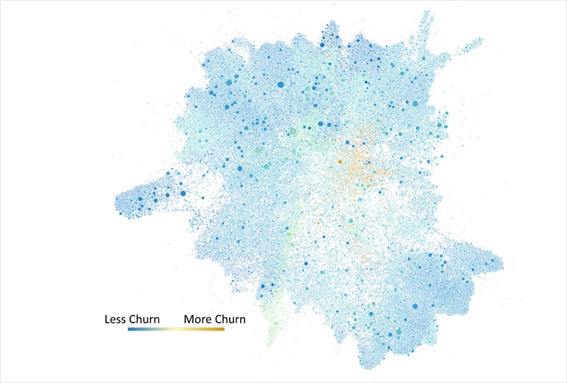
Most employees retained their existing collaborations and even expanded their networks beyond their customary workgroups. For the strategic and operational “control center” of the organization, however, the degree of churn was dramatic. This makes sense – the charter of such groups is to absorb external shocks and chart a course towards recovery while allowing the core engines of productivity to proceed uninterrupted. Such focused churn is a sign of dedicated crisis response, and when combined with the net growth of individual networks, is a clear marker of organizational resilience. In contrast, a “panic response” would manifest as large-scale churn across the organization as connections and work are dropped, while “threat rigidity” would show as individual networks growing smaller and more stable as people double down on what and who they already know.
Building on this single-company view, we expanded our analysis to examine the effects of the Covid-19 pandemic across organizations and industries. The latest Microsoft Work Trends Index describes how one such analysis incorporated 122 billion email interactions and 2.3 meeting interactions across industries and countries, showing an overall increase in the “siloed” nature of workgroups with strong internal relationships and clear group boundaries (the “modularity” metric). In this preprint (opens in new tab) describing a related collaboration with the University of Washington and Johns Hopkins University, we present the analysis of 360 billion email interactions across more than 4000 organizations. The main finding here is that the workgroup silos emerging in response to the pandemic have a different membership structure to pre-pandemic times – and that this new structure has persisted over time.
In other words, we have observed the mass adaptation in the organization of work towards smaller, more defined, and fundamentally different workgroups than existed before the pandemic. While such adaptation suggests resilient response, whether the resulting structures helps to drive resilient recovery is an open and active research question.
Resilience principles in action
- Tackle the causes and consequences of systemic vulnerability
- The pandemic-induced shift to remote working has created an always-on culture that puts the health of both employees and businesses at risk, since people and organizations operating closest to their limits are the least resilient to future shocks. Workgroup maps provides a unified and unit-level view of how the structure and demands of work activities are evolving over time.
- Convene and participate in broad coalitions with a bias for action
- Within Microsoft, we are developing our organizational resilience capabilities in collaboration with Workplace Analytics, Office, and others. Externally, we are collaborating with Johns Hopkins University on “Organizational Dynamics to Enable Post-Pandemic Return to Work” through a funded study on pandemic preparedness and the University of Washington Foster School of Business on the implications of such organizational dynamics for business management.
- Contribute a “resilience toolbox” of open tools and technologies
- We have released the graph statistics and visualization capabilities behind our workgroup maps via the open-source Graspologic (opens in new tab) library. This library is the result a merging our previous topologic package with the GraSPy package developed by our collaborators at JHU, creating a unified source of advanced graph algorithms for the Python community.
- Understand the links between people, practices, and outcomes
- This work focuses on capturing and modelling the people networks implicit in organizational collaboration logs. How these networks partition into communities – and how these communities can be characterized by various graph statistics and network metrics – yields high-level insights into the practice of work that can be compared against known work outcomes and other covariates.
- Democratize expert workflows and real-world evidence development
- Our workgroup mapping pipeline automates collaboration log analysis and presentation-building workflows in ways that democratize expert workflows from two distinct areas of expertise. The resulting presentation artefacts, together with the outputs of our large-scale analyses, represent new sources of real-world evidence that can be used to inform and evaluate organizational policy.
- Build trust through transparency and value-sensitive design
- Any use of organizational network analysis must respect the privacy of individual employees represented in unit-level visualizations such as network layouts (where each node is one member of the organization). Our approach is to select metrics that are neither inherently good or bad, but which represent desirable variation in practice, and calculate and communicate these at a level that aggregates the contributions of many individuals (e.g., the sub-organization or workgroup level).
- Design for transformation at the mesoscale of activity
- Organizations are a key entity at the mesoscale of society. Revealing the structure and dynamics of organizational activities in a way that helps shape positive organizational policies is an efficient way of reaching and benefiting many individuals. Even within organizations, we focus on the mesoscale of communities or workgroups as the implicit and underrecognized units of organization against which policy interventions should be planned, implemented, evaluated, and revised.