In the evolving field of software development, professionals are increasingly adopting a modern approach known as service-oriented architecture to enhance the scalability and flexibility of their services and applications. Often utilizing a microservices approach, developers construct software as a collection of small, independently functioning services. This method is particularly advantageous for developing cloud-based software, as it offers numerous benefits over the traditional monolithic architectures, including the ability to separately develop, deploy, and scale individual components of an application. Nevertheless, this approach also introduces challenges, notably the difficulty of offline testing of these services, which can result in issues being discovered only after the software is in use—potentially leading to costly repairs and user dissatisfaction. This underscores the need for careful software deployment, ensuring the software is as free from bugs as possible before it is released.
Currently, the process of setting up monitoring for cloud services relies heavily on trial and error and the expertise of service managers, who must understand the system’s architecture, its dependencies, and the expectations outlined in service-level agreements (SLAs). Often, adjustments to the monitoring setup are made after the service has been launched, in response to emerging problems. This reactive approach can lead to inefficiencies and often misses critical monitoring checks until issues arise. It also creates redundant alerts that waste resources. At the same time, unoptimized monitoring systems may misdetect anomalous behavior, negatively affecting the user experience and potentially extending the time needed for system upgrades or migrations. To improve how we monitor large cloud computing systems, we need to better understand how these systems work. We can then determine how to decrease the number of missed detections while also reducing the number of unnecessary alerts.
Microsoft cloud monitor platforms
When they are properly configured, cloud monitors can help to meet monitoring requirements. At M365 Research, our intelligent monitoring projects tackle the challenges of managing monitor portfolios for large service families, ensuring high reliability and efficiency.
Spotlight: Event Series

Microsoft Research Forum
Join us for a continuous exchange of ideas about research in the era of general AI. Watch the first four episodes on demand.
Azure Monitor (opens in new tab) offers a comprehensive solution for collecting, analyzing, and responding to monitoring data across cloud and on-premises environments, supporting range of resources like applications, VMs, containers (including Prometheus metrics), databases, and security and networking events. However, while it excels in anomaly detection, root cause analysis, and time series analysis, introducing additional intelligence during the monitor setup could further improve its efficacy.
A closer look at monitors and incident detection at Microsoft
In our paper, “Detection Is Better Than Cure: A Cloud Incidents Perspective,” presented at ESEC/FSE 2023 (opens in new tab), we tackled this problem by studying a year’s worth of production incidents at Microsoft to understand misdetection. The goal was to use our insights to inform improvements in data-driven monitoring.
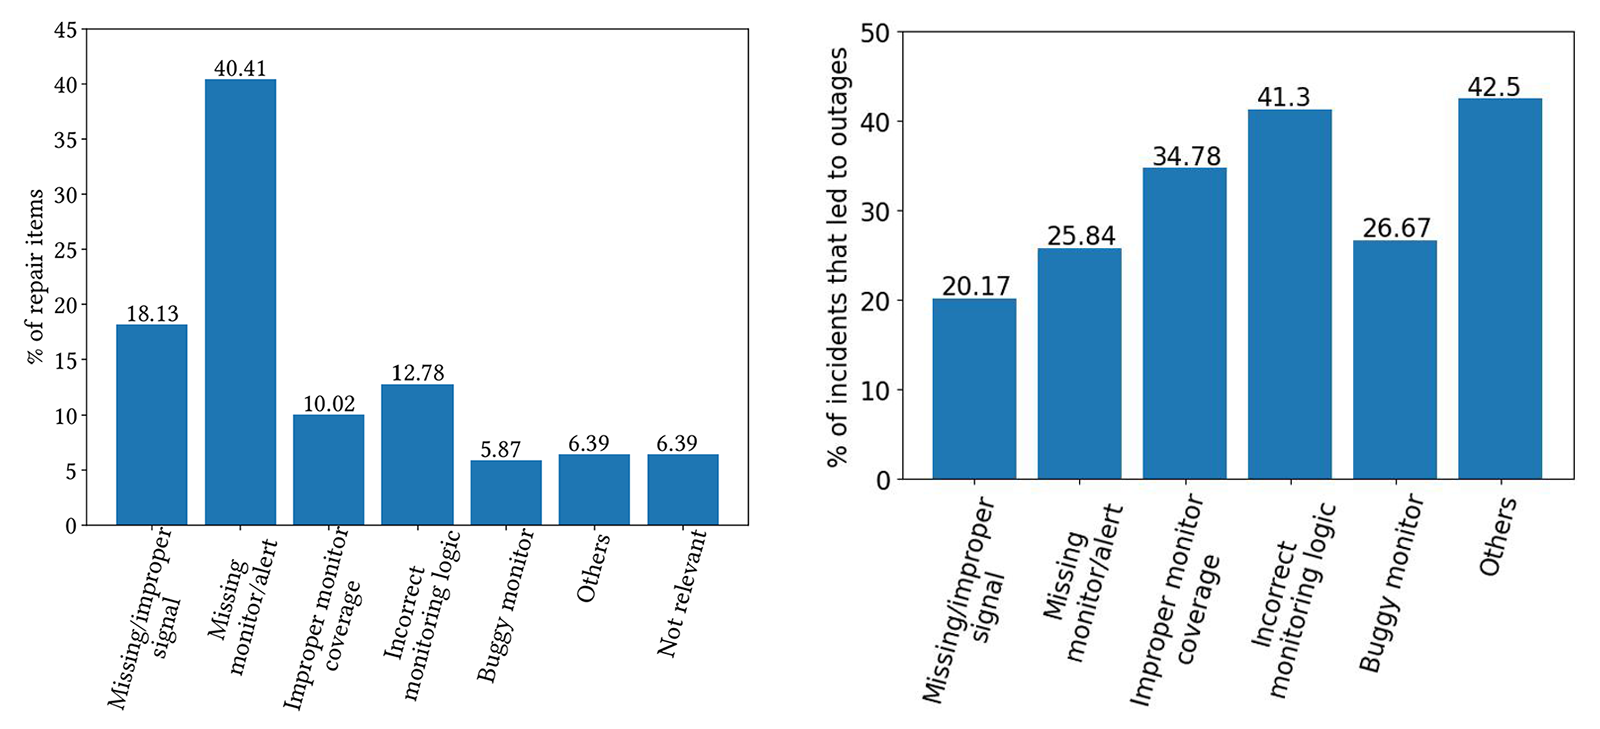
We identified six primary reasons for misdetections, ranging from missing signals and monitors to improper monitor coverage and alerting logic, along with buggy monitors and inadequate documentation. Figure 1 (a) shows the distribution of incident misdetections across a broad range of categories. Notably, missing monitors and alerts constituted over 40 percent of all misdetections, indicating the complexity of determining what to monitor in cloud services. The second most common issue was improper or missing signals, suggesting a need to set up the signals on which new monitors are created. Additionally, approximately 10 percent of monitors had improper coverage, and about 13 percent had alerting logic that needed to be reevaluated. Figure 1 (b) shows that 27.25 percent of these misdetections led to outages, emphasizing the importance of accurately defining monitoring parameters.
Data-driven intelligent monitoring
Organizing monitor data
Because there is no standardized approach to building monitors, monitor data often lacks structure. To address this, we defined a structure comprised of categories, or classes, for the different types of resources being monitored, as well as service-level objective (SLO) classes for their associated objectives. These classes capture the kinds of measurements users may want to perform over a resource.
In our paper, “Intelligent Monitoring Framework for Cloud Services: A Data-Driven Approach,” to be presented at ICSE 2024 (opens in new tab), we propose a data-driven approach for developing this ontology. By leveraging LLMs together with a person-in-the-loop approach, we effectively extract signals from monitor metadata. This approach facilitates the incremental development of monitor ontology and ensures accuracy through human validation and refinement of the predicted results.
Breakdown of resource and SLO classes
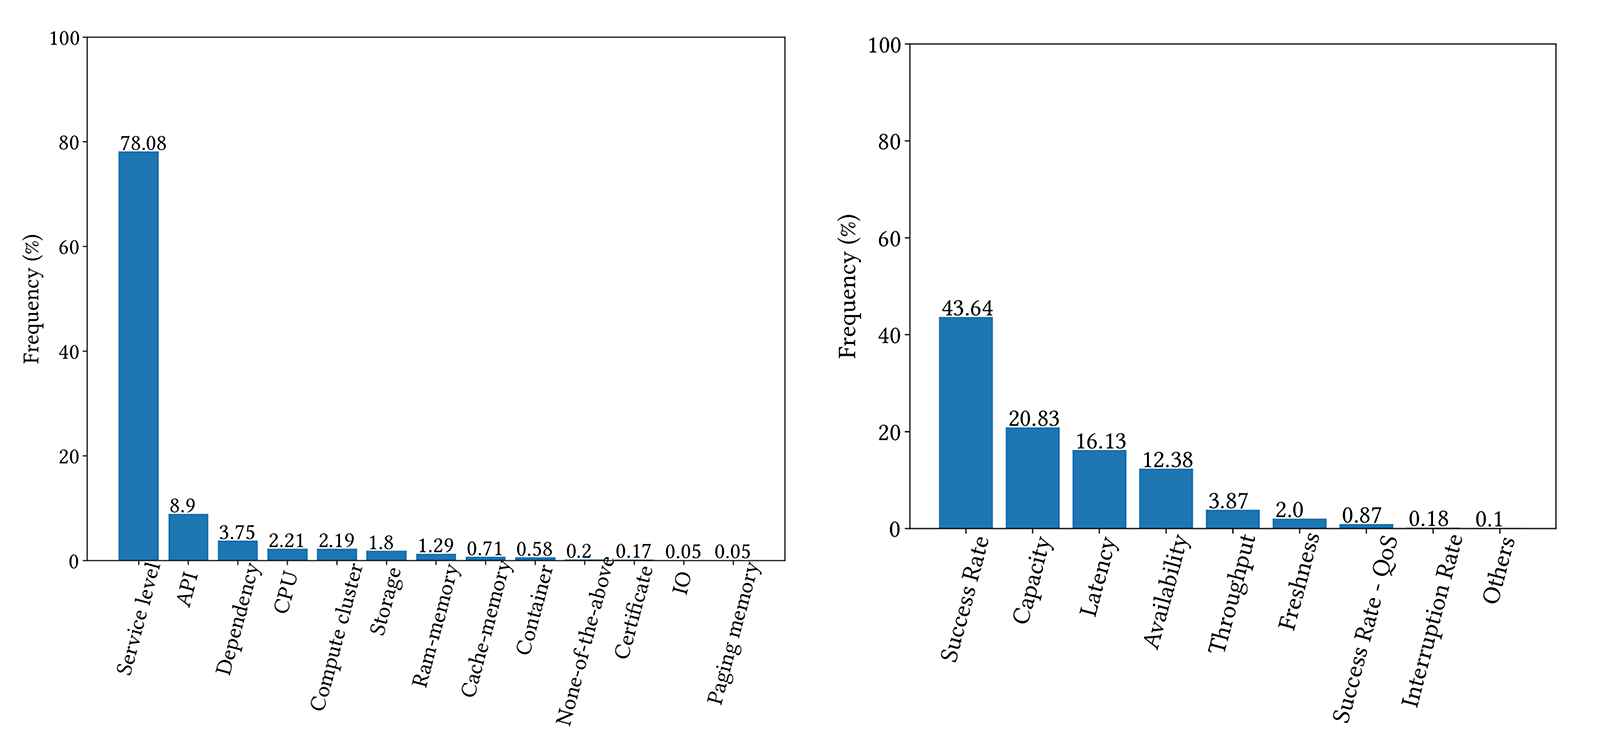
In our analysis, we identified 13 major resource classes and nine SLO classes that correspond to the majority of monitors in our dataset, as shown in Figure 2.
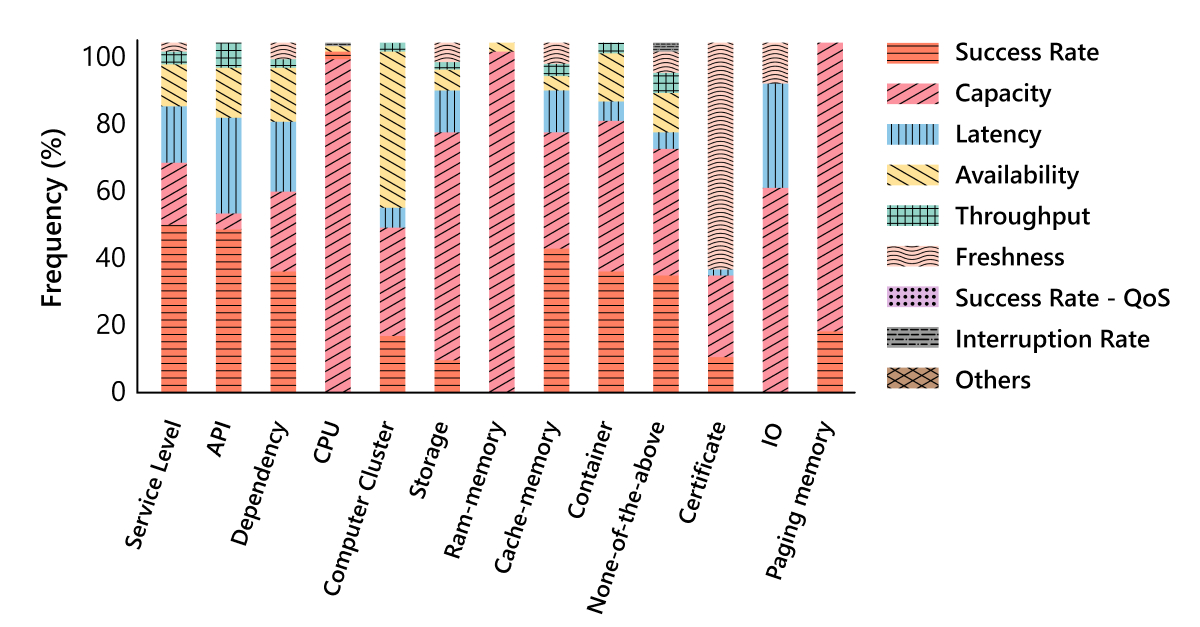
We analyzed the distribution of SLO classes within each resource class to determine the relationship between them. We observed that the distribution varies across resource classes, suggesting that a specific subset of metric classes should be applied to each, as illustrated in Figure 3. This shows us that we can predict a service’s SLO classes by analyzing its associated resource classes.
Monitor recommendation model
We developed a deep learning framework that recommends certain monitors for specific services based on their properties. This model uses monitors that have a structured ontology as well as service properties to create the recommendation pipeline, as shown in Figure 4. It incorporates upstream and downstream dependencies and service components.

To identify patterns within the data, the model uses a prototypical learning network, which learns abstract representations of the classes, or prototypes. This approach allows the network to compare prototypes for classification, enabling stronger generalization capabilities. During the prediction stage, the model outputs the class that it identifies as the most probable, with custom thresholds ensuring the recommendations are of production quality. This is illustrated in Table 1.
| Resource Class | Threshold | Precision | Recall |
|---|---|---|---|
| Service Level | 0.45 | 0.95 | 1.00 |
| API | 0.30 | 0.48 | 1.00 |
| CPU | 0.20 | 0.34 | 1.00 |
| Container | 0.40 | 0.30 | 0.38 |
| Dependency | 0.20 | 0.28 | 1.00 |
| Compute Cluster | 0.05 | 0.30 | 1.00 |
| Storage | 0.35 | 0.22 | 1.00 |
| Ram-memory | 0.30 | 0.20 | 1.00 |
| Certificate | 0.50 | 0.14 | 0.80 |
| Cache-memory | 0.41 | 0.13 | 0.88 |
| Others | 0.40 | 0.10 | 0.90 |
Finally, to understand the importance and utility of the monitor’s recommendations and how engineers perceive them, we interviewed 11 Microsoft engineers who modified monitors from January to June 2023. We introduced the proposed ontology, asked if it was helpful, and solicited suggestions for new classes. The average rating for the ontology was 4.27 out of 5, indicating its usefulness.
Looking ahead
Developing an ontology for monitoring, alongside a recommendation framework to create performance monitors for cloud platforms, marks the initial steps towards tackling the complexities associated with monitor management. One planned project, called Monitor Scorecards, aims to systematically analyze monitor performance through incident reports, their downstream impact, resolution time, and coverage. This approach combines Bayesian statistics with time-series modeling to estimate monitor effectiveness, offering actionable insights into the monitor portfolio’s performance by classifying and quantifying both false positives and negatives. We hope these effectiveness assessments will enhance recommendation models’ training phase and improve the recommendations they make.
Acknowledgments
We would like to thank colleagues from the Azure Health Platform team, Microsoft Research, and the Data, Knowledge, and Intelligence (DKI) team, for contributing to this work.