

Ram Hariharan and Will Dubyak
For thousands of years mariners have understood the value of the North Star as a beacon to help navigate a journey. It is a trusted source of truth; reference to it is the basis of life and death navigational decisions. If they adhere to its message, they find their way home. They ignore it at their peril.
We must measure user impact to continue enhancing Copilot User Experience.
This post addresses application of A/B testing and the North Star metric to this question. It uses an actual example to demonstrate test set up, interpretation of results, and sound decision making. It shows the power of these tools and highlights the hazards of too-rapid interpretation.
There are many technical improvements deriving from thoughtful application of A/B Experimentation, but this paper should be viewed from the perspective of enhancing customer experience; our focus is always doing what we must to make customers more successful. Given the increasing embrace of Copilot across the range of our products, we see a tremendous opportunity to use experimentation to make Copilot more impactful on the end-to-end experience.
This post is not a recipe; there are volumes written about testing and metrics. Nor is it a comprehensive overview of the example use case. It is meant to illustrate how A/B testing and metrics in real life can be applied and show how misinterpretation or misuse can lead to weaker decision making.
Two key ideas:
- You must have a well understood and impactful North Star metric to successfully develop your model.
- You must remain flexible; your actions will not always have the expected effect.
The use case
Microsoft Power Automate is a low-code tool to create a flow to streamline automating repetitive processes. Power Automate Copilot makes creating flows easy, saving user time and effort. Users simply describe the automated workflow they want in everyday language and Copilot transforms the words into a flow, jumpstarting the authoring process. For example, a text input “Send me a notification when I get a high importance email from my manager” generates this flow:
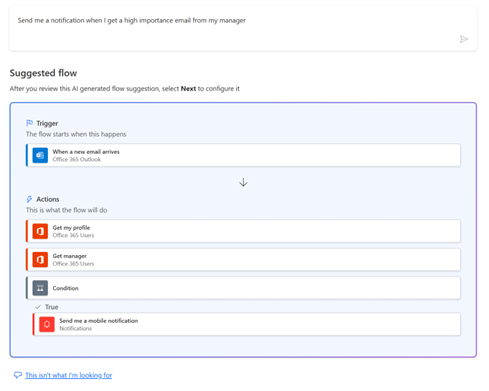
This is a terrific opportunity to leverage natural language input; Power Automate was among Microsoft’s first AI Copilot use cases released publicly. Data suggests workflows built with AI run far more often than those built manually. Users are more likely to use Copilot if we make it easier, helping them automate more of their scenarios. This suggests a natural experiment.
Our research question has two parts:
- If we make Copilot entry easier, will it increase the use of AI Assistance?
- If more users start using Copilot, will it reflect in greater adoption leading to measurable customer impact?
The goal of this post is four-fold:
- Describe design and execution of an A/B test.
- Understand interplay between different metrics in A/B testing.
- Selection of proxy metrics
- Illustrate guidelines to make good decisions with test results.
Some Building Blocks
This section provides basic definitions. When a process has many moving parts, there are many levers. But caution is required.
- A/B testing: a statistical experiment in which a sample of users is drawn randomly and separated into two groups: Control and Treatment. At the end we compare the actions of the two groups. This is governed by a basic assumption (below).
- Treatment Group: We want to make a change of some kind. The users receiving the change are in the Treatment Group. The change is called the Treatment.
- Control Group: A group selected to be left untouched and similar to the Treatment Group. If assumptions hold, we have a start at understanding treatment impact.
- Metrics: Measurements of outcomes. In a process there can be many, each with a different message. It is critical to choose one that speaks to the question being asked; often the most relevant message is learned from a point far from the actual experiment. We use three types in our work (below).
The Metric Framework
By “Metric Framework” we acknowledge many measurable outcomes in a complex flow. North Star is our target metric. It is related to outcomes driving overall process efficacy; it is the one that makes us best. But it is only one of three types:
- Leading Metric: for local impacts (such as modification of a single step in AI Copilot). It is generally quite sensitive to feature changes; it can move quickly when change is induced, because the metric is generally quite close to the action. In our running example, it is the decision to use AI for flow design. Measurement is fast.
- North Star: More revealing. It does not move as fast as Leading Metric but speaks clearly to process end state. In our running example, we typically think of Flow Value per User as our North Star (we use save rate as a proxy); our hypothesis is that decisions to run a workflow indicate maker satisfaction with the results.
- Lagging Metric: The Lagging Metric is the slowest response to changes; it is often removed in time or sequence from the modified process. In our example, a lagging metric would be closer to the business such as increased usage or higher revenue.
Each metric is unique and valuable. “Leading” is most easily influenced: it’s our main lever. We study all of these but focus on North Star and (to some extent) Lagging Metrics. They are slower to react, but more revealing of true impact and business value.
Experimentation + North Star
Our obligation is to proceed carefully.
Experimentation enables focus on what matters, while using scientific discipline to control what we can at intermediate steps. It helps explain the impact of early process modifications on the North Star Metric which responds to change slowly. We move it by systematically altering individual parts of a process, one at a time. Our experimentation program is to select the processes that ultimately most impact North Star.
Experimentation in action
We rely on Experimentation (not intuition/human judgement) to modify a process. We will simplify entry to Copilot to see if more users choose to try AI-assisted flow. This is a leading metric; we will have near real-time feedback when a user chooses to try this out.
But that isn’t enough; it doesn’t matter if more people try Copilot if they don’t use the output. We also explore this impact using User Save Rate as a proxy. (This tradeoff is routine in experimentation. While run rate is measurable, it is complex, and it does not move quickly in real time; we use save rate as a proxy because, presumably, flows are saved with the intent of running it later.)
We use sound statistical practices in selecting a sample for these experiments; it goes well beyond convenience samples or simply observing for a while. In an observational (non-experimental) scenario we don’t have the insight we need to establish a causal connection between action and changes in our North Star (or any other) metric. We can’t know if systemic or environmental conditions also play a part in an outcome. Here is why.
Suppose we have a variable Y whose performance we’d like to optimize, but which is also a function of many inputs. In our example Y is Save Rate, our North Star proxy. We hypothesize that a variable X impacts Y. If this is true, we theorize that we can control Y by manipulating X.
Suppose we test this hypothesis by manipulating X and observing how Y changes during some period. We are happy if Y improves, but what have we proved?
The answer is, unfortunately, very little. The strongest statement we can make is that there is an association between X and our North Star Y. Our test offers no assurance that environmental changes are not driving the observed change in Y. To make a stronger statement we must use a disciplined statistical experiment.
Our goal is to identify a modification (and associated Leading Metric) with a causal impact on our business: to say that, within a confidence level, we believe a change in X causes a change in Y. We seek to demonstrate reasoned inference about ultimate changes in the NS metric in response to manipulation of the hypothesized causal variable. Until we establish this connection, we are relying on hope, not science, to improve our feature.
A/B Experimentation is the most accepted way to establish causality between variables in a system. It lets researchers hold the environment constant while manipulating the X variable. In “A/B testing” subjects in the sample are randomly separated into groups that do/do not receive the “treatment”. Random assignment to these categories ensures that groups are equivalent when the study begins, so we can infer that treatment drives observed changes in the outcome.
- The key consideration in experiment design is making certain that systemic/environmental effects not under control of the researcher are averaged out across the sample; if experimental units are randomly assigned to treatment/control groups, with a large enough sample environmental influences will average out. This gives reasonable assurance that variation between treatment and control groups is due to the treatment variable.
- Experimentation allows us to separate an action from the environment.
North Star Metric; an example
We will test two hypotheses:
- The new home page entry point Copilot gets more users to try the Copilot powered experience.
- The new Copilot powered method increases the flow save rate.
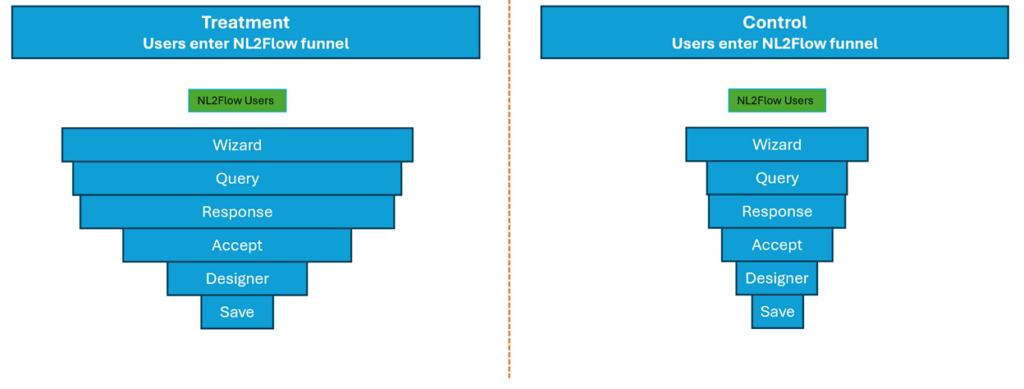
The Figure below will help. There are 5 steps in the process. We will modify the way users opt in to Copilot by placing entry points on the home page. Our treatment group gets a new way of entering the funnel from the homepage; control group sees the original entry mechanism (Traditional entry points have been from “Create” and “My Flows” pages.). The Treatment group automatically sees a Copilot enabled designer; the Control Group must deliberately transit to Copilot. Note that there is NO change in the process of building an AI assisted flow; that process is accessible regardless of how a user enters. The test is for one specific question only: what happens if we make getting started more discoverable? Since evidence suggests AI-assisted flows are run more often, this might be a way to generate more usage.
The figure below represents the experimental results geometrically. The sample size was identical for treatment and control groups; breadth of the horizontal bar representing each step is proportional to a positive response.
Copilot assistance in flow construction has been in use in Power automate since last fall, but there is evidence to suggest that some users are unaware of this functionality. This experiment tests the hypothesis that implementation of this Copilot AI call-for-action banner will help more users discover Copilot, enter the flow funnel, ultimately resulting in saving and running a flow.
While the actual data has been redacted and this funnel is a little dated, the results are striking.
- The enhanced entry option draws users at double the original rate.
- This pattern endures through the Query, Response, and Accept stages; the treatment group remains in the funnel at a significantly higher rate.
- The pattern alters at the Designer; now the control group retains at a higher rate from the last step than treatment. The save rate is also higher in control than treatment.
What do we learn
This use-case adds clarity to the care with which experimental results must be interpreted.
- Our hypothesis: get more people into the experience by simplifying entry. This experiment suggested this is true: entry rate was > double the original method. This trend endures for the next several levels of the funnel.
- Things change at the designer. In this experiment, all advantages of the new entry method diminish: users, for whatever reason, do not make it through the designer, even though the designer is also enhanced.
- We seek to maximize North Star, which is “Flow Value Per User”. We don’t directly move the NS (a lagging metric). However, a key leading metric driving NS is “user flow save rate” which measures the rate at which users save flows. By moving the user flow save rate, the NS metric is moved.
- Save rate is actually lower in the new experience.
This emphasizes the key idea of using A/B testing in conjunction with the North Star.
The dramatic improvement in the rate at which the new users enter the experience, on its own, suggests that we should make this entry standard for all users.
But the decline in the treatment group save rate in the experiment suggests otherwise. Fortunately, lessons learned in other experiments offer potential explanations.
Our working hypothesis is that new users who react to the entry banner are less likely to understand the designer process; users who understand AI supported mechanisms for flow creation are more likely to save and run the flow. This is supported by data: despite much higher rates of entry from the new Homepage endpoint, 57% of created flows came from original methods. The Homepage entry accounted for 43%; on the whole, users coming from the home page saved their flows at a 25% lower rate.
Which suggests the next set of experiments for A/B testing and product improvements!
Take aways
First, A/B testing is best regarded as an incremental process. We can rapidly gather insight, but we must be cautious about reacting to a specific outcome until we have studied the entire process.
Second, interplay between Leading metrics and the North Star is critical to success. Improvement at an intermediate step in a workflow (such as significant increase in entry) is of no use until it leads to a corresponding improvement in primary success metrics (such as save rate).
Finally, in experimentation we are constrained by what we can measure. Accordingly, we use Save Rate as a proxy for Run rate. And we temper our response to some experimental results if the outcome is inconsistent with other indicators at our disposal (i.e., the fall in save rate does not match other evidence that says AI generated flows run at a much higher rate than original flows.) We use each result as an opportunity to learn, and to plan our next experiment to continually improve the value customers derive from increasingly delightful experiences.