

Imagine that you have developed a new hypothesis for how to improve the user experience of your product. Now you need to test it. There are many ways that you could approach this. For instance, running an A/B test, engaging directly with users, or sending out a survey.
Each of these methods fall into one of two categories. The first is quantitative. This is the process of collecting and analyzing numerical data. The second is qualitative. This is the process of collecting and analyzing data in the form of text or observations to understand concepts, opinions, and/or experiences. While both methods can provide key insights into the user experience, they each excel in answering different types of questions. Thus, effective measurement and analysis should encompass both categories. This is the approach that Microsoft’s Developer Division (the team that brings you Visual Studio and Visual Studio Code) employs.
In this blog post, we highlight some of the qualitative and quantitative methods that we use to help us develop our tools. We will explain how we think about choosing a qualitative method alongside quantitative analysis and conclude with an example of a product pain point we solved using both methodologies.
Methods for making data-driven product decisions
What are qualitative methods?
Qualitative research provides insights into the user experience with techniques such as usability studies (opens in new tab) [1], surveys (opens in new tab) [2], focus groups (opens in new tab) [3], customer interviews (opens in new tab) [4], and diary studies (opens in new tab) [5]. In Microsoft’s Developer Division, we use a combination of these methods.
Now, you might be wondering, “How do I know which method to choose?” Great question! The right method largely depends on the research question that you have in mind. By identifying 1-to-3 open-ended research questions, you can determine whether your focus is generative or evaluative research (opens in new tab) [6]. This can help you to identify which method(s) to use. You may feel that you want to conduct more generative research if your research questions are aimed at helping you build a mental model of a problem space or identify new opportunities for your product (e.g., “How do users typically use my product?”). Conversely, evaluative research takes center stage if you want to determine how to alleviate a pain point or improve usability (e.g., “Will this prototype meet my users’ needs?”).
While there isn’t a hard and fast rule about which methods best tease out which type of information, some methods are better suited to answering generative research questions (e.g., customer interviews) while others are better suited for answering evaluative research questions (e.g., usability studies).
At first you might be hesitant to try out new qualitative methods. Yet it is important to approach qualitative research with an open mind and with the goal of learning more about your users. This may even include gleaning insights that were completely different than those that you anticipated.
What are quantitative methods?
Quantitative research provides insights into the user experience at scale. In Microsoft’s Developer Division, quantitative research usually falls into one of two buckets: telemetry monitoring and A/B testing. Like qualitative research, the method that you choose largely depends on the question that you want to answer.
When we have questions about the current experience of our product, we use telemetry monitoring. This involves things like setting up dashboards or tracking user interactions (e.g., hitting an error). These methods can reveal product pain points that can help us to prioritize where to make improvements. When we want to evaluate a specific hypothesis for how to improve a product or to ensure that a new change won’t negatively impact users, we use A/B testing. A/B tests allows us to determine the effect that a new experience has on our full population of users. This makes it possible to measure the impact of individual changes against our larger business goals/metrics.
While both quantitative methods can reveal broad patterns of user behavior, they provide different insights. So, it is important to use both in product development to match the objectives of your research.
It’s not either-or: Combining quantitative and qualitative methods
When it comes to using quantitative methods or qualitative methods, it’s not a question of one or the other. Rather, ask, “What is my research question?” Or “What problem am I trying to solve?” Moreover, you’ll likely need both types of methods to come away with a decision that you feel confident about.
Quantitative data can help us establish a baseline and get some ground truth data. What’s more, it can help us get that information at scale and over a diverse population. We can develop hypotheses and rigorously evaluate them by running A/B tests. Often, quantitative methods are superheroes at answering “what” questions. For instance, what is really happening here? What is the impact?
Conversely, qualitative methods allow us to collect supporting data that help us to make sense of what is happening, evaluate potential solutions before implementing them, and build empathy for our users. Since we don’t have to implement a full solution, it can oftentimes be easier to receive user feedback using qualitative methods rather than large-scale A/B tests. One set of qualitative research alone isn’t going to be enough to validate or invalidate a design or a hypothesis (because chances are your sample of users is not representative of your entire population). Qualitative methods allow us to address “why” questions. For example, why do users want to do that? Why will or won’t this solution work?
To build a robust mental model of a problem space, we usually cycle through “what” and “why” questions to iterate on our understanding of the area. So, to answer the question of when to use which set of methods, the answer is “it depends…,” and “…it’s probably both!”
Using both quantitative and qualitative methods to improve a product: Pylance case study
What is Pylance?
At a high level, Pylance (opens in new tab) [7] and other language servers provide all the bells and whistles of a good developer experience for writing Python code in tools such as Visual Studio Code, Visual Studio, and Azure Notebooks. It provides features like auto-completion, code navigation, function signature help, and refactoring code actions. Pylance also gives us diagnostics on problematic code (e.g., errors and warnings for code that will not run). Python users in Visual Studio Code now expect diagnostics, a feature that inherently helps build trust in the product and overall development experience.
The problem: False-positive diagnostics
A recent example where the Pylance language server team was able to leverage both quantitative and qualitative methods to solve a major pain point in the product was in lessening the number of false positives that occurred during import diagnostics. Diagnostics in VS Code appear as squiggles under problematic or incorrect/invalid lines of code.
In this case, a false positive diagnostic on an unresolved import meant that Pylance was flagging incorrect lines of code as problematic because it detected that the corresponding imported modules could not be found in the project (either in user-defined code or in third-party modules).
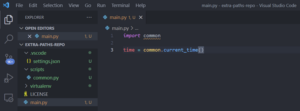
Example Python code in VS Code with an unresolved import.
Approaching the problem space
Making the language server smarter, carefully
Looking at the telemetry, we quickly discovered this problem was more widespread than we previously thought. Ideally, we don’t want users to have to deal with implementation or language-specific details. So, the first plan of attack to improve the experience was to make Pylance smarter. We wanted to reduce the unresolved imports and avoid manual interaction with Pylance settings before tackling potential UI changes that increased the discoverability of the setting.
As a team, we designed some new logic that could potentially improve the way that Pylance resolves imports. However, our team had concerns about adding this into the product as permanent logic because while this heuristic would almost certainly decrease the number of unresolved imports in user code and improve completion coverage, it was also possible that other user experience and performance metrics would degrade.
With that in mind, the best course of action for us was to roll this out via an A/B test so that we could measure the impact of this change at scale. The A/B test also provided us with the ability to shut the new experience down quickly if we saw the user experience start to degrade. The hypothesis that we tested was that the heuristic would improve metrics measuring resolving imports without degrading key guardrail metrics related to product performance and successful engagement with Pylance.
Doubling down on our approach via qualitative methods
The heuristic only addressed one case that caused unresolved imports. So, we also wanted to explore options for improving the discoverability of the feature’s related setting. While an A/B test can tell us that users are using a setting more often, it does not easily tell us why users prefer one UI over another. These questions are best suited for evaluative qualitative methods. So, while the A/B test was running, we started concept-value testing new user interface options.
Concept-value testing provides insight into the understanding and perception your users have around a particular idea. It does this by soliciting feedback on the usefulness of a proposed solution. For this study, we recruited several Visual Studio Code users and showed them mockups of different user interface options aimed at addressing our goal of increasing the discoverability of a setting. We asked probing questions about the UI to participants first broadly (e.g., “What do you think this is supposed to do?”) and then more targeted (e.g., “What if we told you that this button is supposed to do x/y/z?”). This allowed us to capture both their expectations for how the UI would work and how they felt about the intended design.
Coming out of the concept-value testing we discovered that the new UI was considerably more actionable and educational than the existing experience and associated documentation. As such, we opted to implement the mockup that was most well-received by our concept-value testing participants.
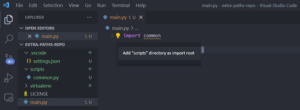
Example mockup seen by participants in concept-value testing.
Synthesizing qualitative and quantitative outcomes
After finishing the concept-value testing, we also had results from our A/B test. The results confirmed that there was a statistically significant improvement in the way Pylance resolves imports without degrading the product’s performance. This confirmed our hypothesis that this heuristic would benefit users. Given the confirming evidence for both changes, we shipped both to the product. Our work, however, was not complete. These two data points have opened new questions on how to improve Pylance that will be explored further through both qualitative and quantitative methods.
Putting things together
To answer a given research question, it’s important to first identify what methodology would be the best place to start answering your question – quantitative or qualitative. Are you looking to get baseline data, or does your question need to be measured at scale? If so, starting with quantitative methods (e.g., A/B testing, measurement via telemetry) is best. Do you want to better understand why your users behave in a certain way or understand what their perceptions are of your feature? If the answer is yes, then start with qualitative methods (e.g., customer interviews, usability testing).
Although you might start with one type of research, you should remember that it’s advisable to use both qualitative and quantitative methods in tandem. This will help you to tease out meaningful insights and make data-driven decisions for your product. When combined thoughtfully, the sum of quantitative and qualitative methods yield more value than either does independently.
–Savannah Ostrowski (Microsoft Developer Division), Julie Stevenson (Microsoft Experimentation Platform)
References
[1] K. Moran, “Usability Testing 101.” https://www.nngroup.com/articles/usability-testing-101/ (opens in new tab).
[2] S. Farrell, “28 Tips for Creating Great Qualitative Surveys.” https://www.nngroup.com/articles/qualitative-surveys/ (opens in new tab).
[3] User Interviews, “Focus Groups.” https://www.userinterviews.com/ux-research-field-guide-chapter/focus-groups
[4] E. Dopson, “A comprehensive guide to in-depth interviews (IDIs).” https://www.userzoom.com/interviews/comprehensive-guide-to-in-depth-interviews-idis/ (opens in new tab).
[5] M. Hasley and E. Tibias, “How to Conduct a Diary Study: A Start-to-Finish Guide.” https://dscout.com/people-nerds/diary-study-guide (opens in new tab).
[6] J. Estes, “Generative vs. evaluation research: what’s the difference and why do we need each?” https://www.usertesting.com/blog/generative-vs-evaluation-research (opens in new tab).
[7] “Pylance.” https://marketplace.visualstudio.com/items?itemName=ms-python.vscode-pylance (opens in new tab).