This project illustrates how complex data can be visualized using a web browser in both mixed and plain reality to immerse a user in a story and communicate insights. Immersive visualization and storytelling techniques allow insights in complex data to be communicated more effectively.
A browser-based WebGL application maximizes reach across devices and form-factors, from mobile to large-format displays. The web-based approach also allows embedding within existing websites. Fully immersive, mixed-reality experiences are also supported direct from the browser via WebVR.
Visualizations are created using tabular data and a web-based authoring tool. This approach to presenting and sharing findings in data offers an alternative approach to static charts or dynamic dashboards. 3D visualizations are fully supported.
Collaborative experiences across multiple web-browsers are supported. A device can join a visualization session using a simple QR-code or short URL. Control can be given to allow participants to drive the experience. This approach enables an interactive discussion about data.
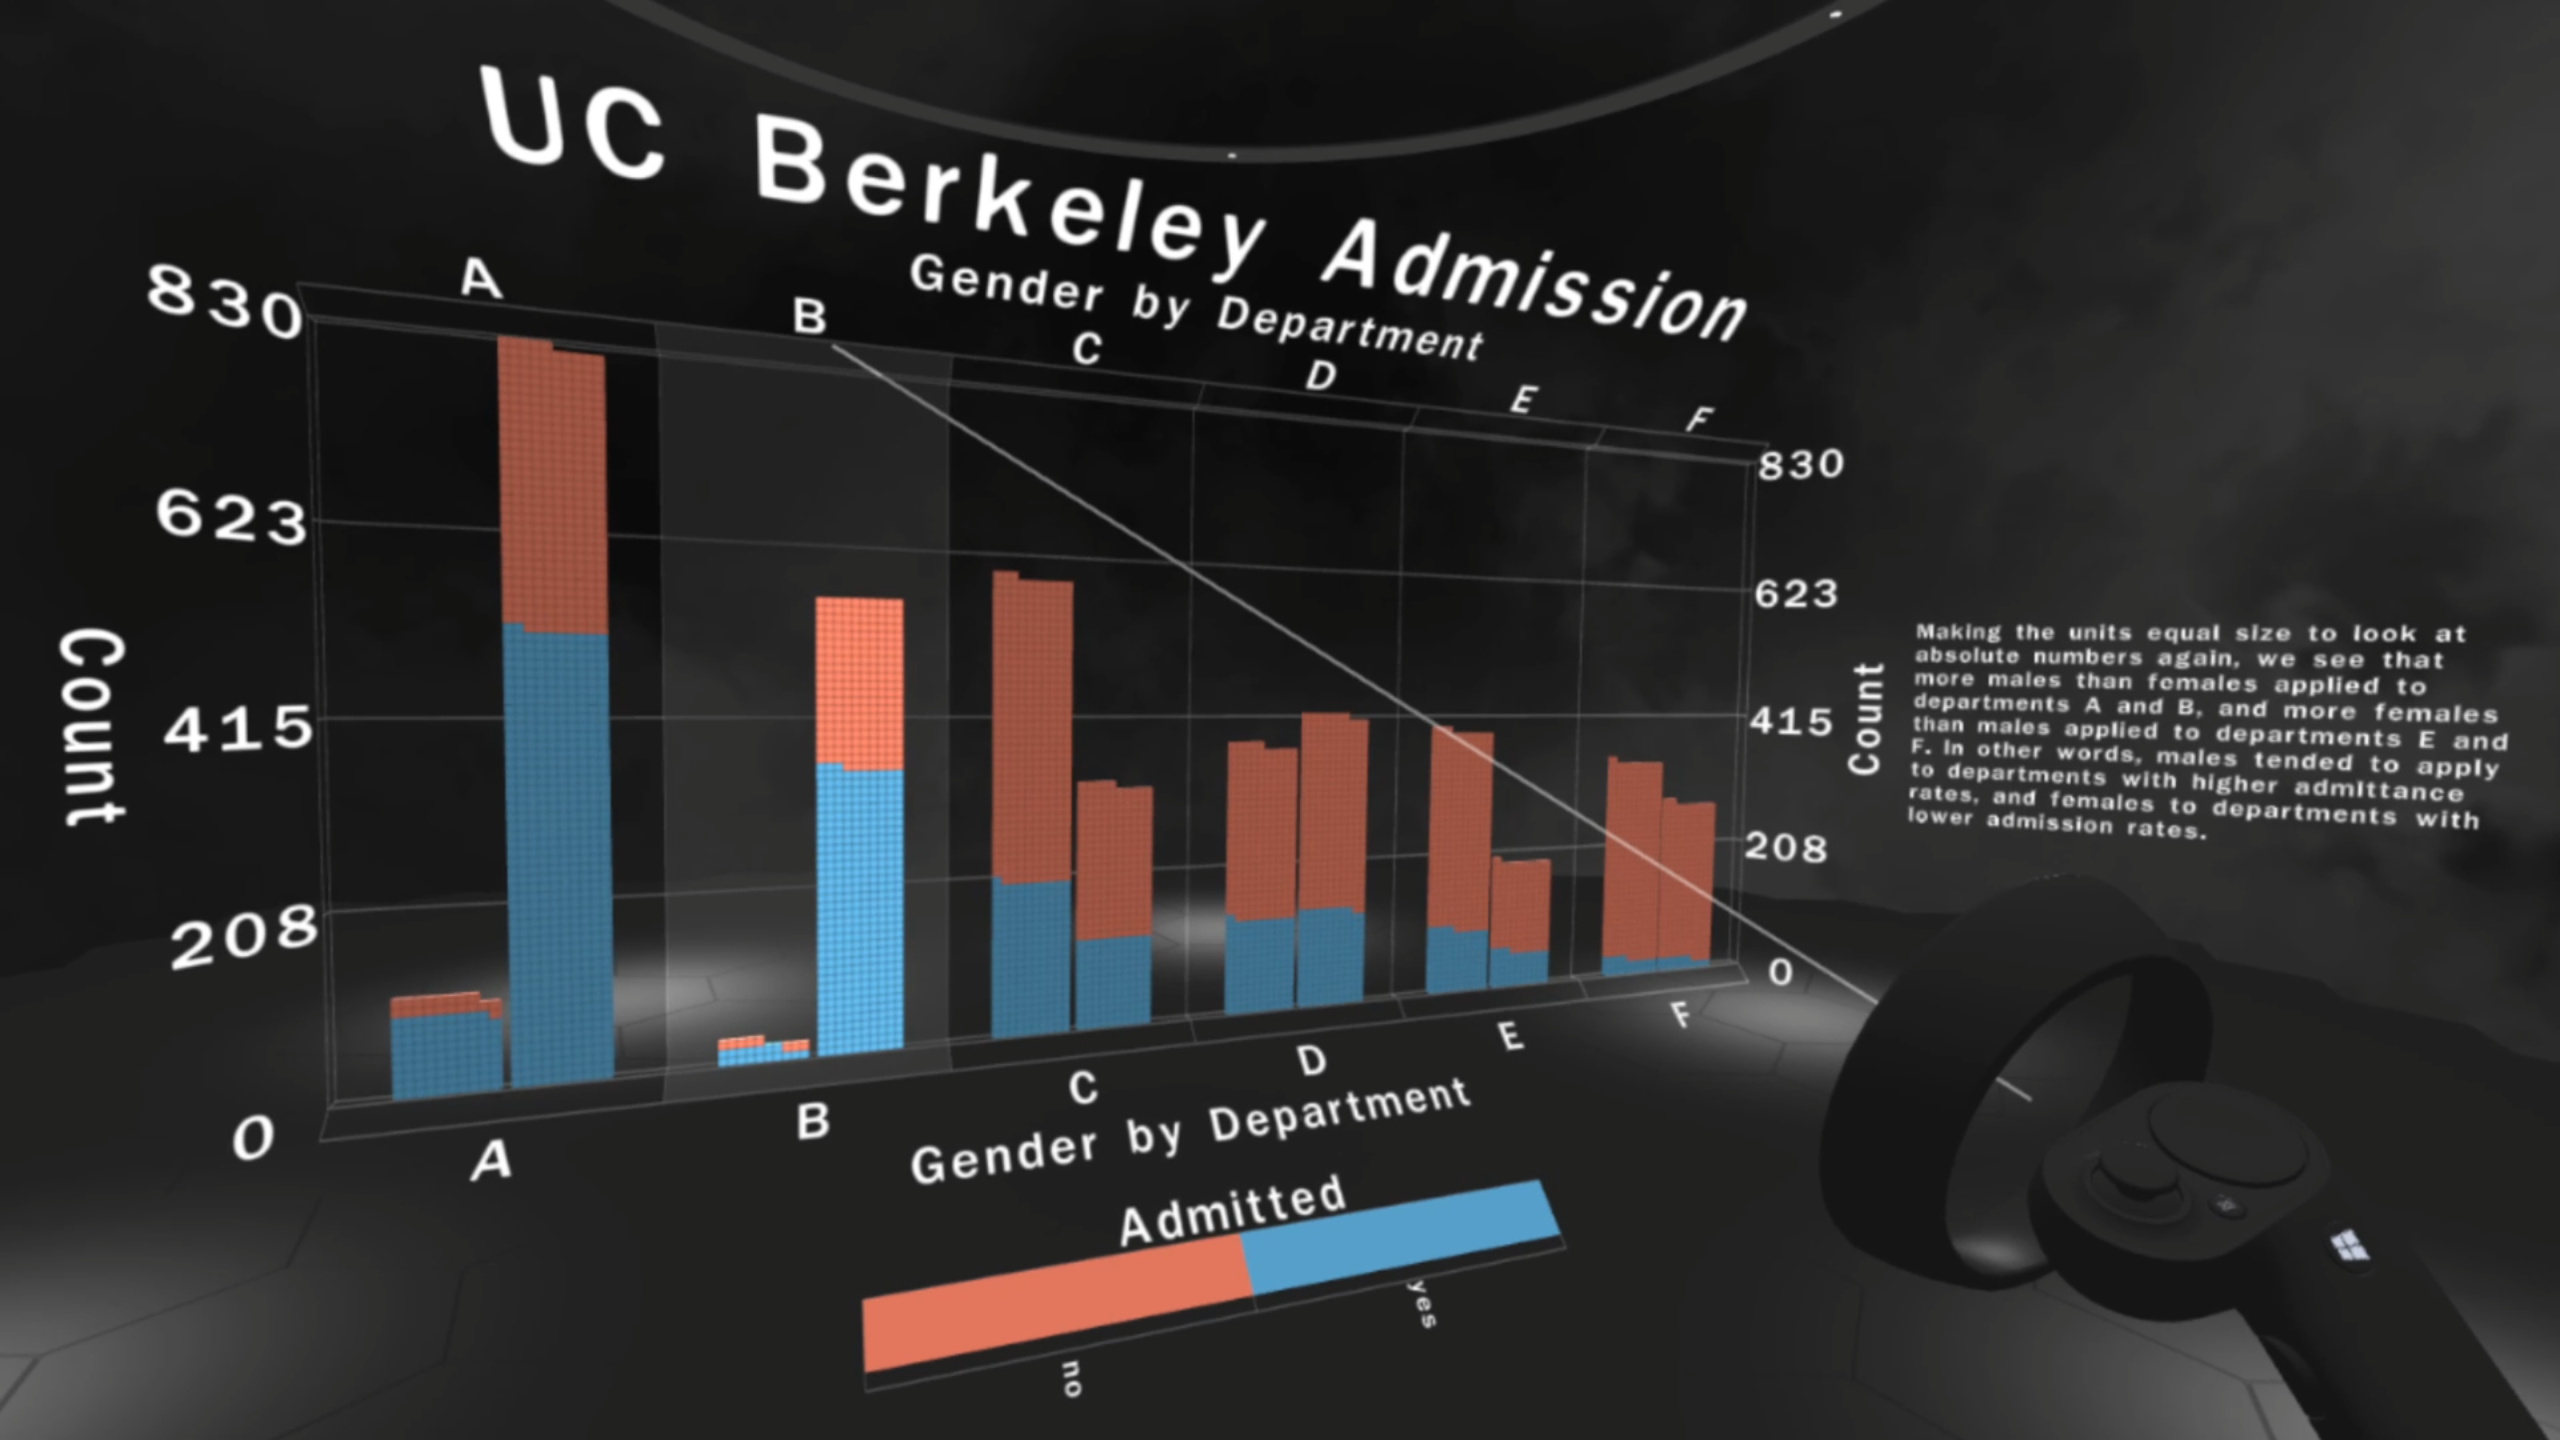
Immersive virtual reality experiences.
The following examples show how animated transitions can be used as part of the storytelling process.