

Forecasting & modeling
The ability to model and forecast disease transmission, behavior, risk factors, illness and mortality is important for making public health decisions and allocating resources that can help mitigate the impact of a pandemic. The modeling community around the world continues to develop and evolve their techniques, which can be challenging in the fact of uncertainty in many forms. The research here between researchers at Microsoft and collaborators around the world demonstrates innovative new methods for mathematical modeling and forecasting different aspects of a pandemic.
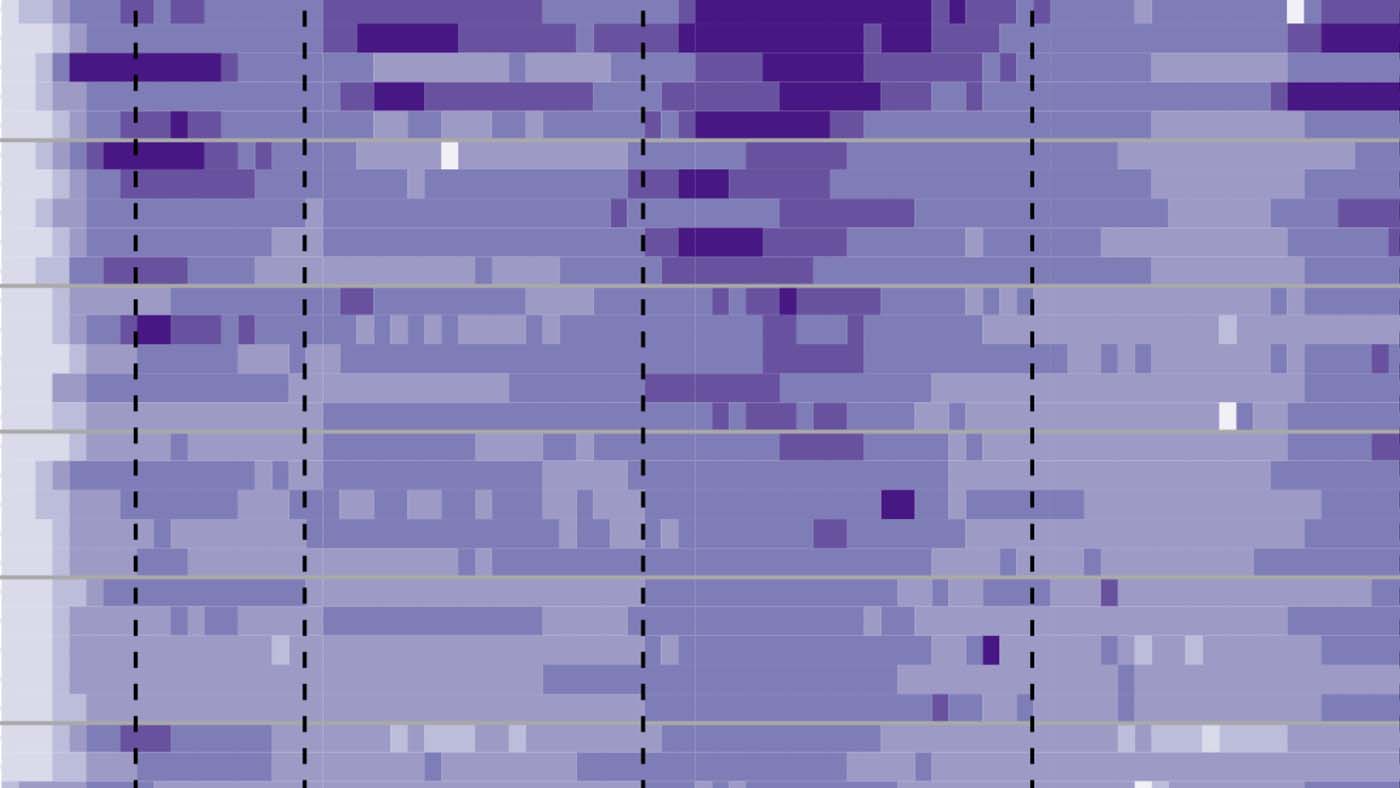
Improving COVID-19 mortality forecasts by using an ensemble model
Pandemic forecasting models inform leaders and the general public on critical decisions such as healthcare staffing needs, school closures, and medical supply allocations. Results from individual COVID-19 forecasting models in the U.S. can be highly variable in their accuracy in predicting incident deaths. In contrast, an ensemble model that collected and synthesized tens of millions of specific forecasts from more than 90 different research groups provided greatly improved accuracy in predicting COVID-19 mortality. The project highlights the importance of cooperation and coordination between governmental public health agencies, academic modeling teams, and industry partners to develop modern modeling capabilities to assist in responding to outbreaks at the local, state, and federal levels.
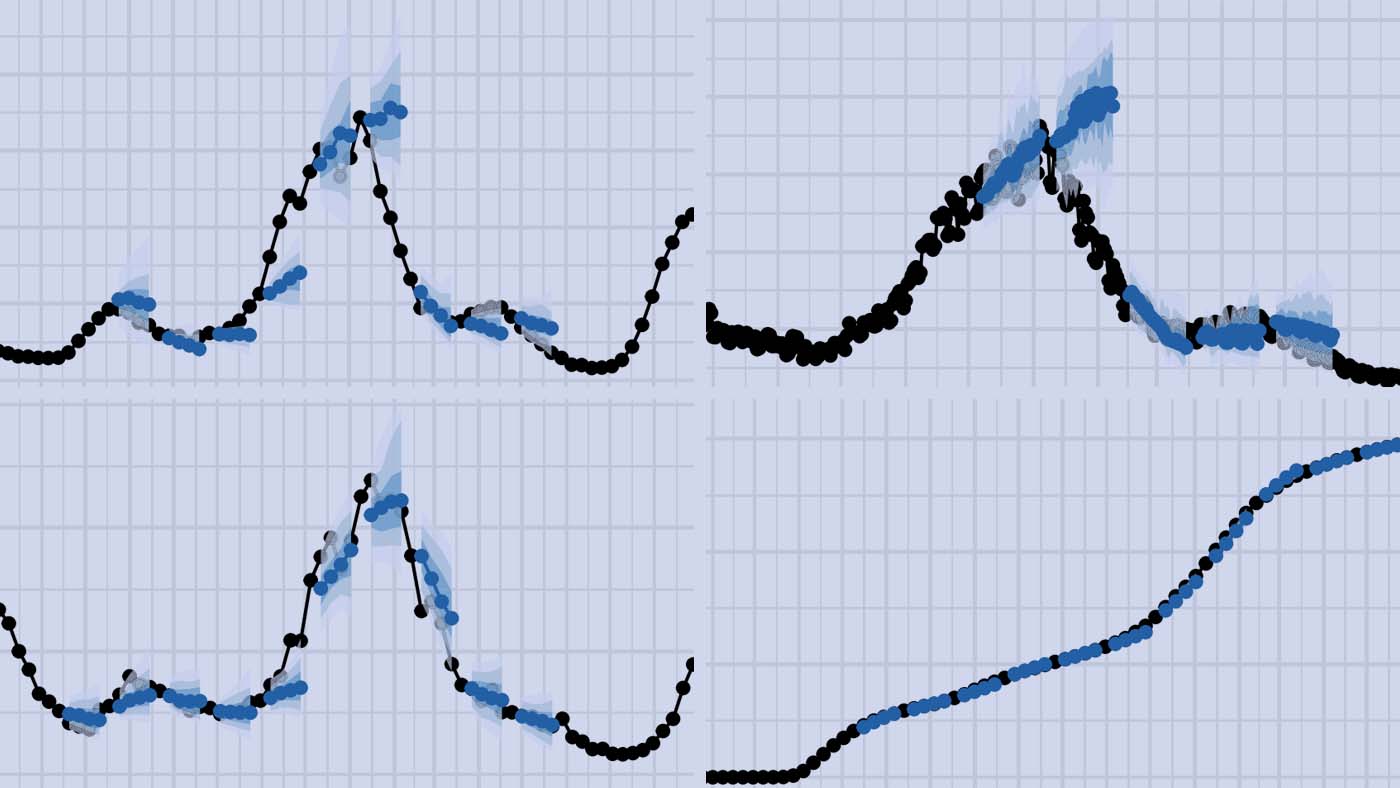
The United States COVID-19 Forecast Hub Dataset
Academic researchers, government agencies, and industry groups produced a myriad of forecasts during the COVID-19 pandemic. To leverage these forecasts, the U.S. Centers for Disease Control and Prevention (CDC) partnered with an academic research lab at the University of Massachusetts Amherst to create the U.S. COVID-19 Forecast Hub, an open-source dataset with forecasts of COVID-19 cases, hospitalizations, and deaths at the county, state, and national levels. Its goal is to establish a standardized set of short-term forecasts from modeling teams that can be used to develop ensemble models, communicate to the public, and inform mitigation policies.
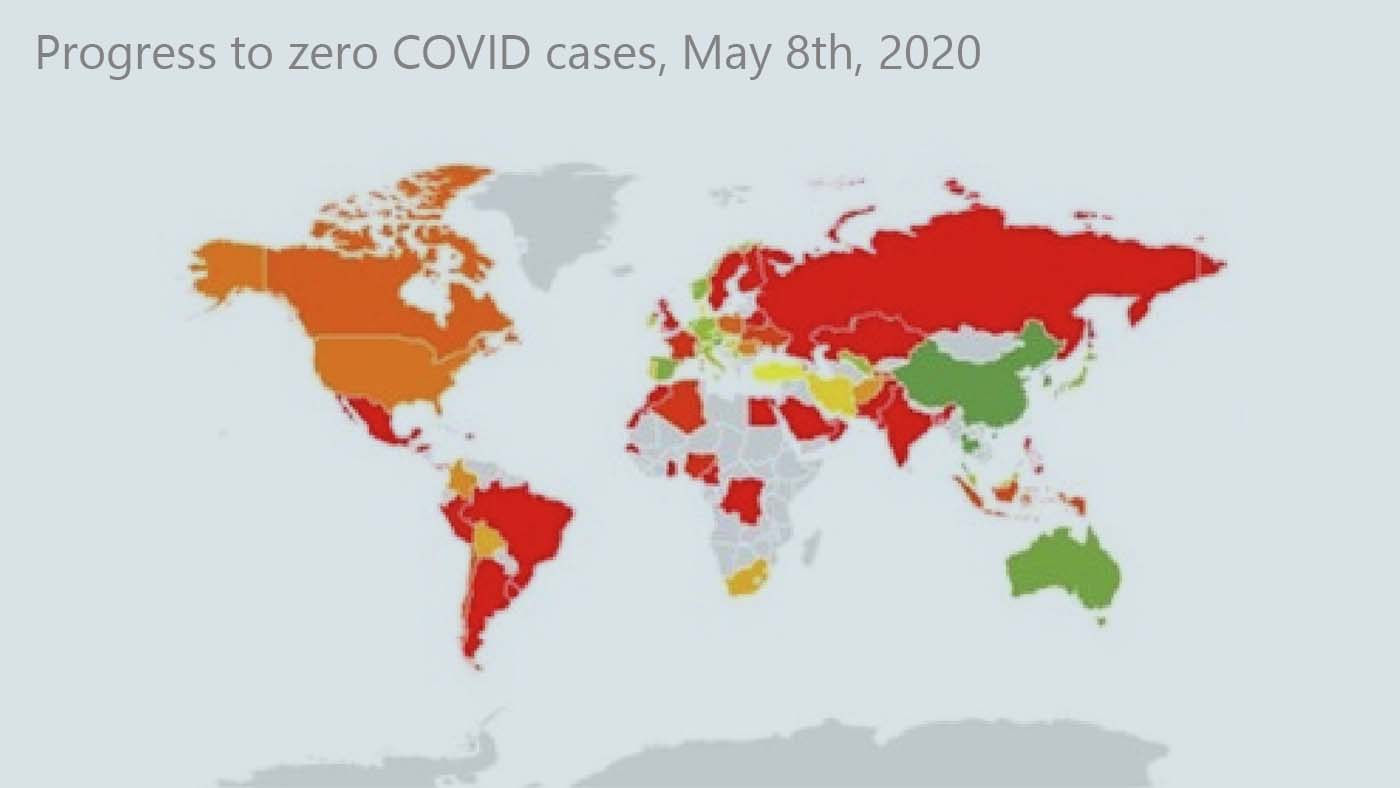
A simple metric to measure COVID-19 progress by country/region
R(t), a metric epidemiologists use in managing the COVID-19 crisis, conveys whether the number of cases is growing, has plateaued, or is declining. But two geographies with similar R(t) numbers could have very different experiences due to individual, biological, and environmental nuances. Here, an alternative metric called “progress to zero” is proposed which describes the percentage decline in case numbers from a previously recorded peak level. This metric is comparable across geographies and better helps leaders visualize progress.
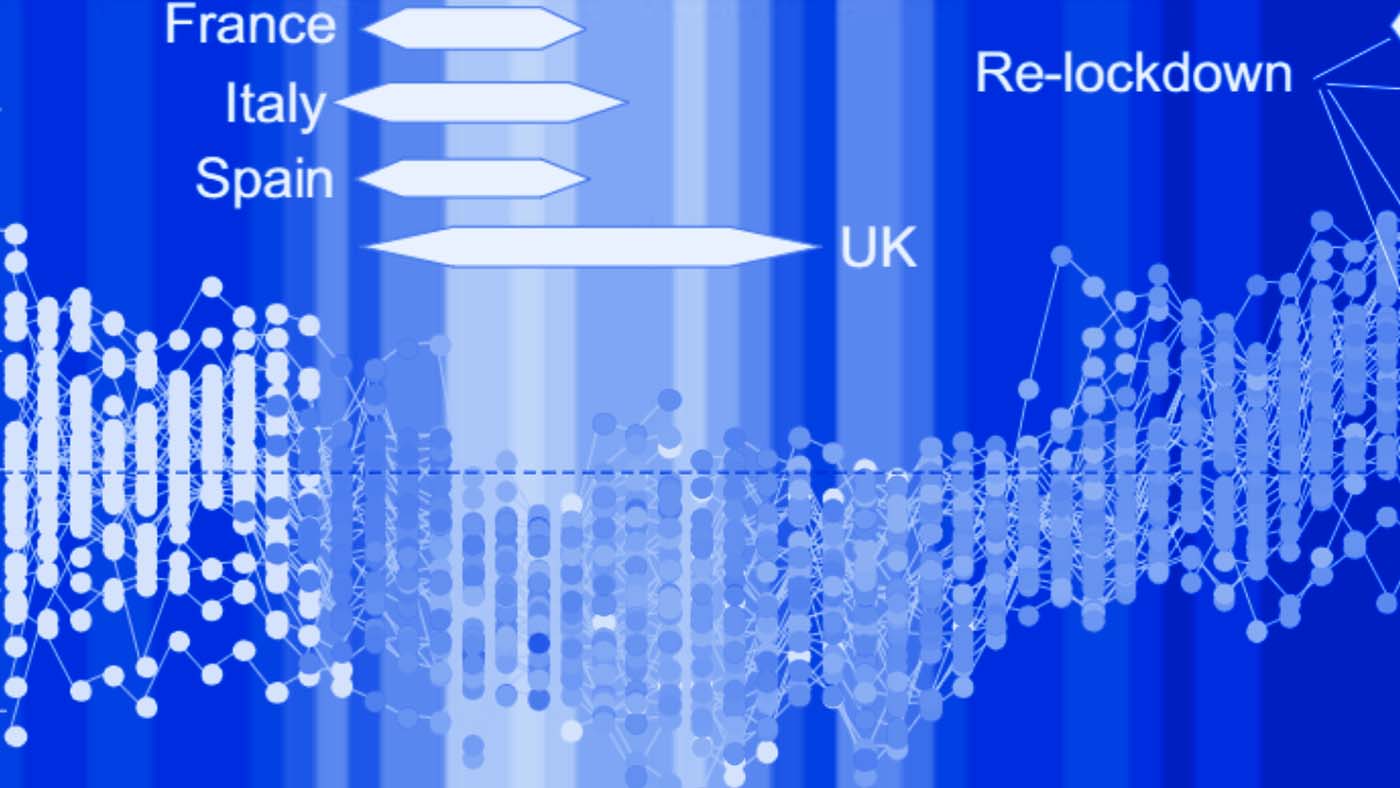
Predicting the effect of confinement on the COVID-19 spread using machine learning enriched with satellite air pollution observations
This study shows how satellite observations of nitrogen dioxide (NO2) can provide surrogate data to monitor economic activity reduction during a pandemic and to monitor the effectiveness of containment measures on the transmission of a virus before vaccines become widely available. By comparing NO2 concentrations during the pandemic to those from 2016 to 2019, researchers were able to track the weekly anomalies in economic activity. The research found that the application of near-real-time satellite NO2 observations produced a much better prediction of the deceleration of COVID-19 cases than other predictors.