GigaTIME: Scaling tumor microenvironment modeling using virtual population generated by multimodal AI

Published

By , General Manager, Real-World Evidence , Senior Researcher , Principal Researcher , Assistant Professor

Illustration of a person kneeling and looking through a large telescope on a textured pink surface. The telescope is aimed at a dark sky filled with colorful circular icons, each containing abstract shapes. The telescope itself has circuit-like patterns inside.

The convergence of digital transformation and the GenAI revolution creates an unprecedented opportunity for accelerating progress in precision health. Precision immunotherapy is a poster child for this transformation. Emerging technologies such as multiplex immunofluorescence (mIF) can assess internal states of individual cells along with their spatial locations, which is critical for deciphering how tumors interact with the immune system. The resulting insights, often referred to as the “grammar” of the tumor microenvironment, can help predict whether a tumor will respond to immunotherapy. If it is unlikely to respond, these insights can also inform strategies to reprogram the tumor from “cold” to “hot,” increasing its susceptibility to treatment.

This is exciting, but progress is hindered by the high cost and limited scalability of current technology. For example, obtaining mIF data of a couple dozen protein channels for a tissue sample can cost thousands of dollars, and even the most advanced labs can barely scale it to a tiny fraction of their available tissue samples.

In our paper published in Cell on December 9, “Multimodal AI generates virtual population for tumor microenvironment modeling (opens in new tab),” we present GigaTIME (opens in new tab), a multimodal AI model for translating routinely available hematoxylin and eosin (H&E) pathology slides to virtual mIF images. Developed in collaboration with Providence and the University of Washington, GigaTIME was trained on a Providence dataset of 40 million cells with paired H&E and mIF images across 21 protein channels. We applied GigaTIME to 14,256 cancer patients from 51 hospitals and over a thousand clinics within the Providence system. This effort generated a virtual population of around 300,000 mIF images spanning 24 cancer types and 306 cancer subtypes. This virtual population uncovered 1,234 statistically significant associations linking mIF protein activations with key clinical attributes such as biomarkers, staging, and patient survival. Independent external validation on 10,200 Cancer Genome Atlas (TCGA) patients further corroborated our findings. 

To our knowledge, this is the first population-scale study of tumor immune microenvironment (TIME) based on spatial proteomics. Such studies were previously infeasible due to the scarcity of mIF data. By translating readily available H&E pathology slides into high-resolution virtual mIF data, GigaTIME provides a novel research framework for exploring precision immuno-oncology through population-scale TIME analysis and discovery. We have made our GigaTIME model publicly available at Microsoft Foundry Labs (opens in new tab) and on Hugging Face (opens in new tab) to help accelerate clinical research in precision oncology.

“GigaTIME is about unlocking insights that were previously out of reach,” explained Carlo Bifulco, MD, chief medical officer of Providence Genomics and medical director of cancer genomics and precision oncology at the Providence Cancer Institute. “By analyzing the tumor microenvironment of thousands of patients, GigaTIME has the potential to accelerate discoveries that will shape the future of precision oncology and improve patient outcomes.” 

PODCAST SERIES

The AI Revolution in Medicine, Revisited

Join Microsoft’s Peter Lee on a journey to discover how AI is impacting healthcare and what it means for the future of medicine.

GigaTIME generates a virtual population for tumor microenvironment modeling

Digital pathology transforms a microscopy slide of stained tumor tissue into a high-resolution digital image, revealing details of cell morphology such as nucleus and cytoplasm. Such a slide only costs $5 to $10 per image and has become routinely available in cancer care. It is well known that H&E-based cell morphology contains information about the cellular states. Last year, we released GigaPath, the first digital pathology foundation model for scaling transformer architectures to gigapixel H&E slides. Afterward, researchers at Mount Sinai Hospital and Memorial Sloan Kettering Cancer Center showed in a global prospective trial that it can reliably predict a key biomarker from H&E slides for precision oncology triaging. However, such prior works are generally limited to average biomarker status across the entire tissue. GigaTIME thus represents a major step forward by learning to predict spatially resolved, single-cell states essential for tumor microenvironment modeling. In turn, this enables us to generate a virtual population of mIF images for large-scale TIME analysis (Figure 1).

Figure 1. GigaTIME enables population-scale tumor immune microenvironment (TIME) analysis. A, GigaTIME inputs a hematoxylin and eosin (H&E) whole-slide image and outputs multiplex immunofluorescence (mIF) across 21 protein channels. By applying GigaTIME to 14,256 patients, we generated a virtual population with mIF information, leading to population-scale discovery on clinical biomarkers and patient stratification, with independent validation on TCGA. B, Circular plot visualizing a TIME spectrum encompassing the GigaTIME-translated virtual mIF activation scores across different protein channels at the population scale, where each channel is represented as an individual circular bar chart segment. The inner circle encodes OncoTree, which classifies 14,256 patients into 306 subtypes across 24 cancer types. The outer circle groups these activations by cancer types, allowing visual comparison across major categories. C, Scatter plot comparing the subtype-level GigaTIME-translated virtual mIF activations between TCGA and Providence virtual populations. Each dot denotes the average activation score of a protein channel among all tumors of a cancer subtype.

GigaTIME learns a multimodal AI model to translate pathology slides into spatial proteomics images, bridging cell morphology and cell states

Figure 2. GigaTIME enables translation from hematoxylin and eosin (H&E) to multiplex immunofluorescence (mIF) images. A,B, Bar plot comparing GigaTIME and CycleGAN on the translation performance in terms of Dice score (A) and Pearson correlation (B). C, Scatter plots comparing the activation density of the translated mIF and the ground truth mIF across four channels. D, Qualitative results for a sample H&E whole-slide image from our held-out test set with zoomed-in visualizations of the measured mIF and GigaTIME-translated mIF for DAPI, PD-L1, and CD68 channels.

GigaTIME learned a cross-modal AI translator from digital pathology to spatial multiplex proteomics by training on 40 million cells with paired H&E slides and mIF images from Providence. To our knowledge, this is the first large-scale study exploring multimodal AI for scaling virtual mIF generation. The high-quality paired data enabled much more accurate cross-modal translation compared to prior state-of-the-art methods (Figure 2).

Virtual population enables population-scale discovery of associations between cell states and key biomarkers

Figure 3. GigaTIME identifies novel TIME protein vs biomarker associations at pan-cancer, cancer type, cancer subtype levels. A, GigaTIME generates a virtual population of 14,256 with virtual mIF by translating available H&E images to mIF images, enabling pan-cancer, cancer type, and cancer subtype levels of biomedical discovery. B-G, Correlation analysis between protein channels in virtual mIF and patient biomarkers reveal TIME protein-biomarker associations at pan-cancer level (B), cancer-type level (C-E), and cancer-subtype level (F,G). Circle size denotes significance strength. Circle color denotes the directionality in which the correlation occurs. Channel color denotes high, medium, and low confidence based on pearson correlations evaluated using test set. H, A case study showcasing the activation maps across different virtual mIF channels for a H&E slide in our virtual population, and virtual mIF of sample patches from this slide.

By applying GigaTIME to Providence real-world data, we generated a virtual population of 14,256 patients with virtual mIF and key clinical attributes. After correcting for multiple hypothesis testing, we have identified 1,234 statistically significant associations between tumor immune cell states (CD138, CD20, CD4) and clinical biomarkers (tumor mutation burden, KRAS, KMT2D), from pan-cancer to cancer subtypes (Figure 3). Many of these findings are supported by existing literature. For example, MSI high and TMB high associated with increased activations of TIME-related channels such as CD138. Additionally, the virtual population also uncovered previously unknown associations, such as pan-cancer associations between immune activations and key tumor biomarkers, such as the tumor suppressor KMT2D and the oncogene KRAS).

Virtual population enables population-scale discovery of tumor immune signatures for patient stratification

Figure 4. GigaTIME enables effective patient stratification across pathological stages and survival groups. A-C, Correlation analysis between virtual mIF and pathological stages at pan-cancer level (A), cancer-type level (B), and cancer-subtype level (C). Circle size denotes significance strength. Circle color denotes the directionality in which the correlation happens. Channel color denotes high, medium, and low confidence based on pearson correlations evaluated using test set. D-F, Survival analysis on lung cancer by using virtual CD3, virtual CD8, and virtual GigaTIME signature (all 21 GigaTIME protein channels) to stratify patients at pan-cancer level (D) and cancer-type level: lung (E), brain (F). G, Bar plot comparing pan-cancer patient stratification performance in terms of survival log rank p-values among virtual GigaTIME signature and individual virtual protein channels.

The virtual population also uncovered GigaTIME signatures for effective patient stratification across staging and survival profiles (Figure 4), from pan-cancer to cancer subtypes. Prior studies have explored patient stratification based on individual immune proteins such as CD3 and CD8. We found that GigaTIME-simulated CD3 and CD8 are similarly effective. Moreover, the combined GigaTIME signature across all 21 protein channels attained even better patient stratification compared to individual channels.

Virtual population uncovers interesting spatial and combinatorial interactions

Figure 5. GigaTIME uncovers interesting spatial and combinatorial virtual mIF patterns. A,B,C Bar plots comparing virtual mIF activation density with spatial metrics on identifying TIME protein-biomarker correlations. We investigated three spatial metrics based on entropy (A), signal-to-noise ratio (SNR) (B), and sharpness (C). D,E, Bar plots comparing single-channel and combinatorial-channel (using the OR logical operation) in biomarker associations for two GigaTIME virtual protein pairs: CD138/CD68 (D) and PD-L1/Caspase 3 (E), demonstrating substantially improved associations for the combination. F, Case studies visualizing the virtual mIF activation maps of individual channels (CD138, CD68; PD-L1, Caspase 3) and their combinations.

The virtual population uncovered interesting non-linear interactions across the GigaTIME virtual protein channels, revealing associations with spatial features such as sharpness and entropy, as well as with key clinical biomarkers like APC and KMT2D (Figure 6). Such combinatorial studies were previously out of reach given the scarcity of mIF data.

Independent external validation on TCGA

Figure 6. Independent validation on a virtual population from TCGA. A, Grid charts showing significantly correlated pan-cancer GigaTIME protein-biomarker pairs in Providence (left), TCGA (middle), and both (right). B, Grid charts showing significantly correlated GigaTIME protein-biomarker pairs for lung cancer in Providence and TCGA. C, Grid chart showing significantly correlated GigaTIME protein-biomarker pairs for LUAD in Providence. Channel color denotes high, medium, and low confidence based on pearson correlations evaluated using test set. D, Case studies with visualizations of H&E slides and the corresponding virtual mIF activations for the pair of a GigaTIME protein channel and a biomarker (mutated/non-mutated), where the patient with the given mutation demonstrates much higher activation scores for that GigaTIME protein channel.

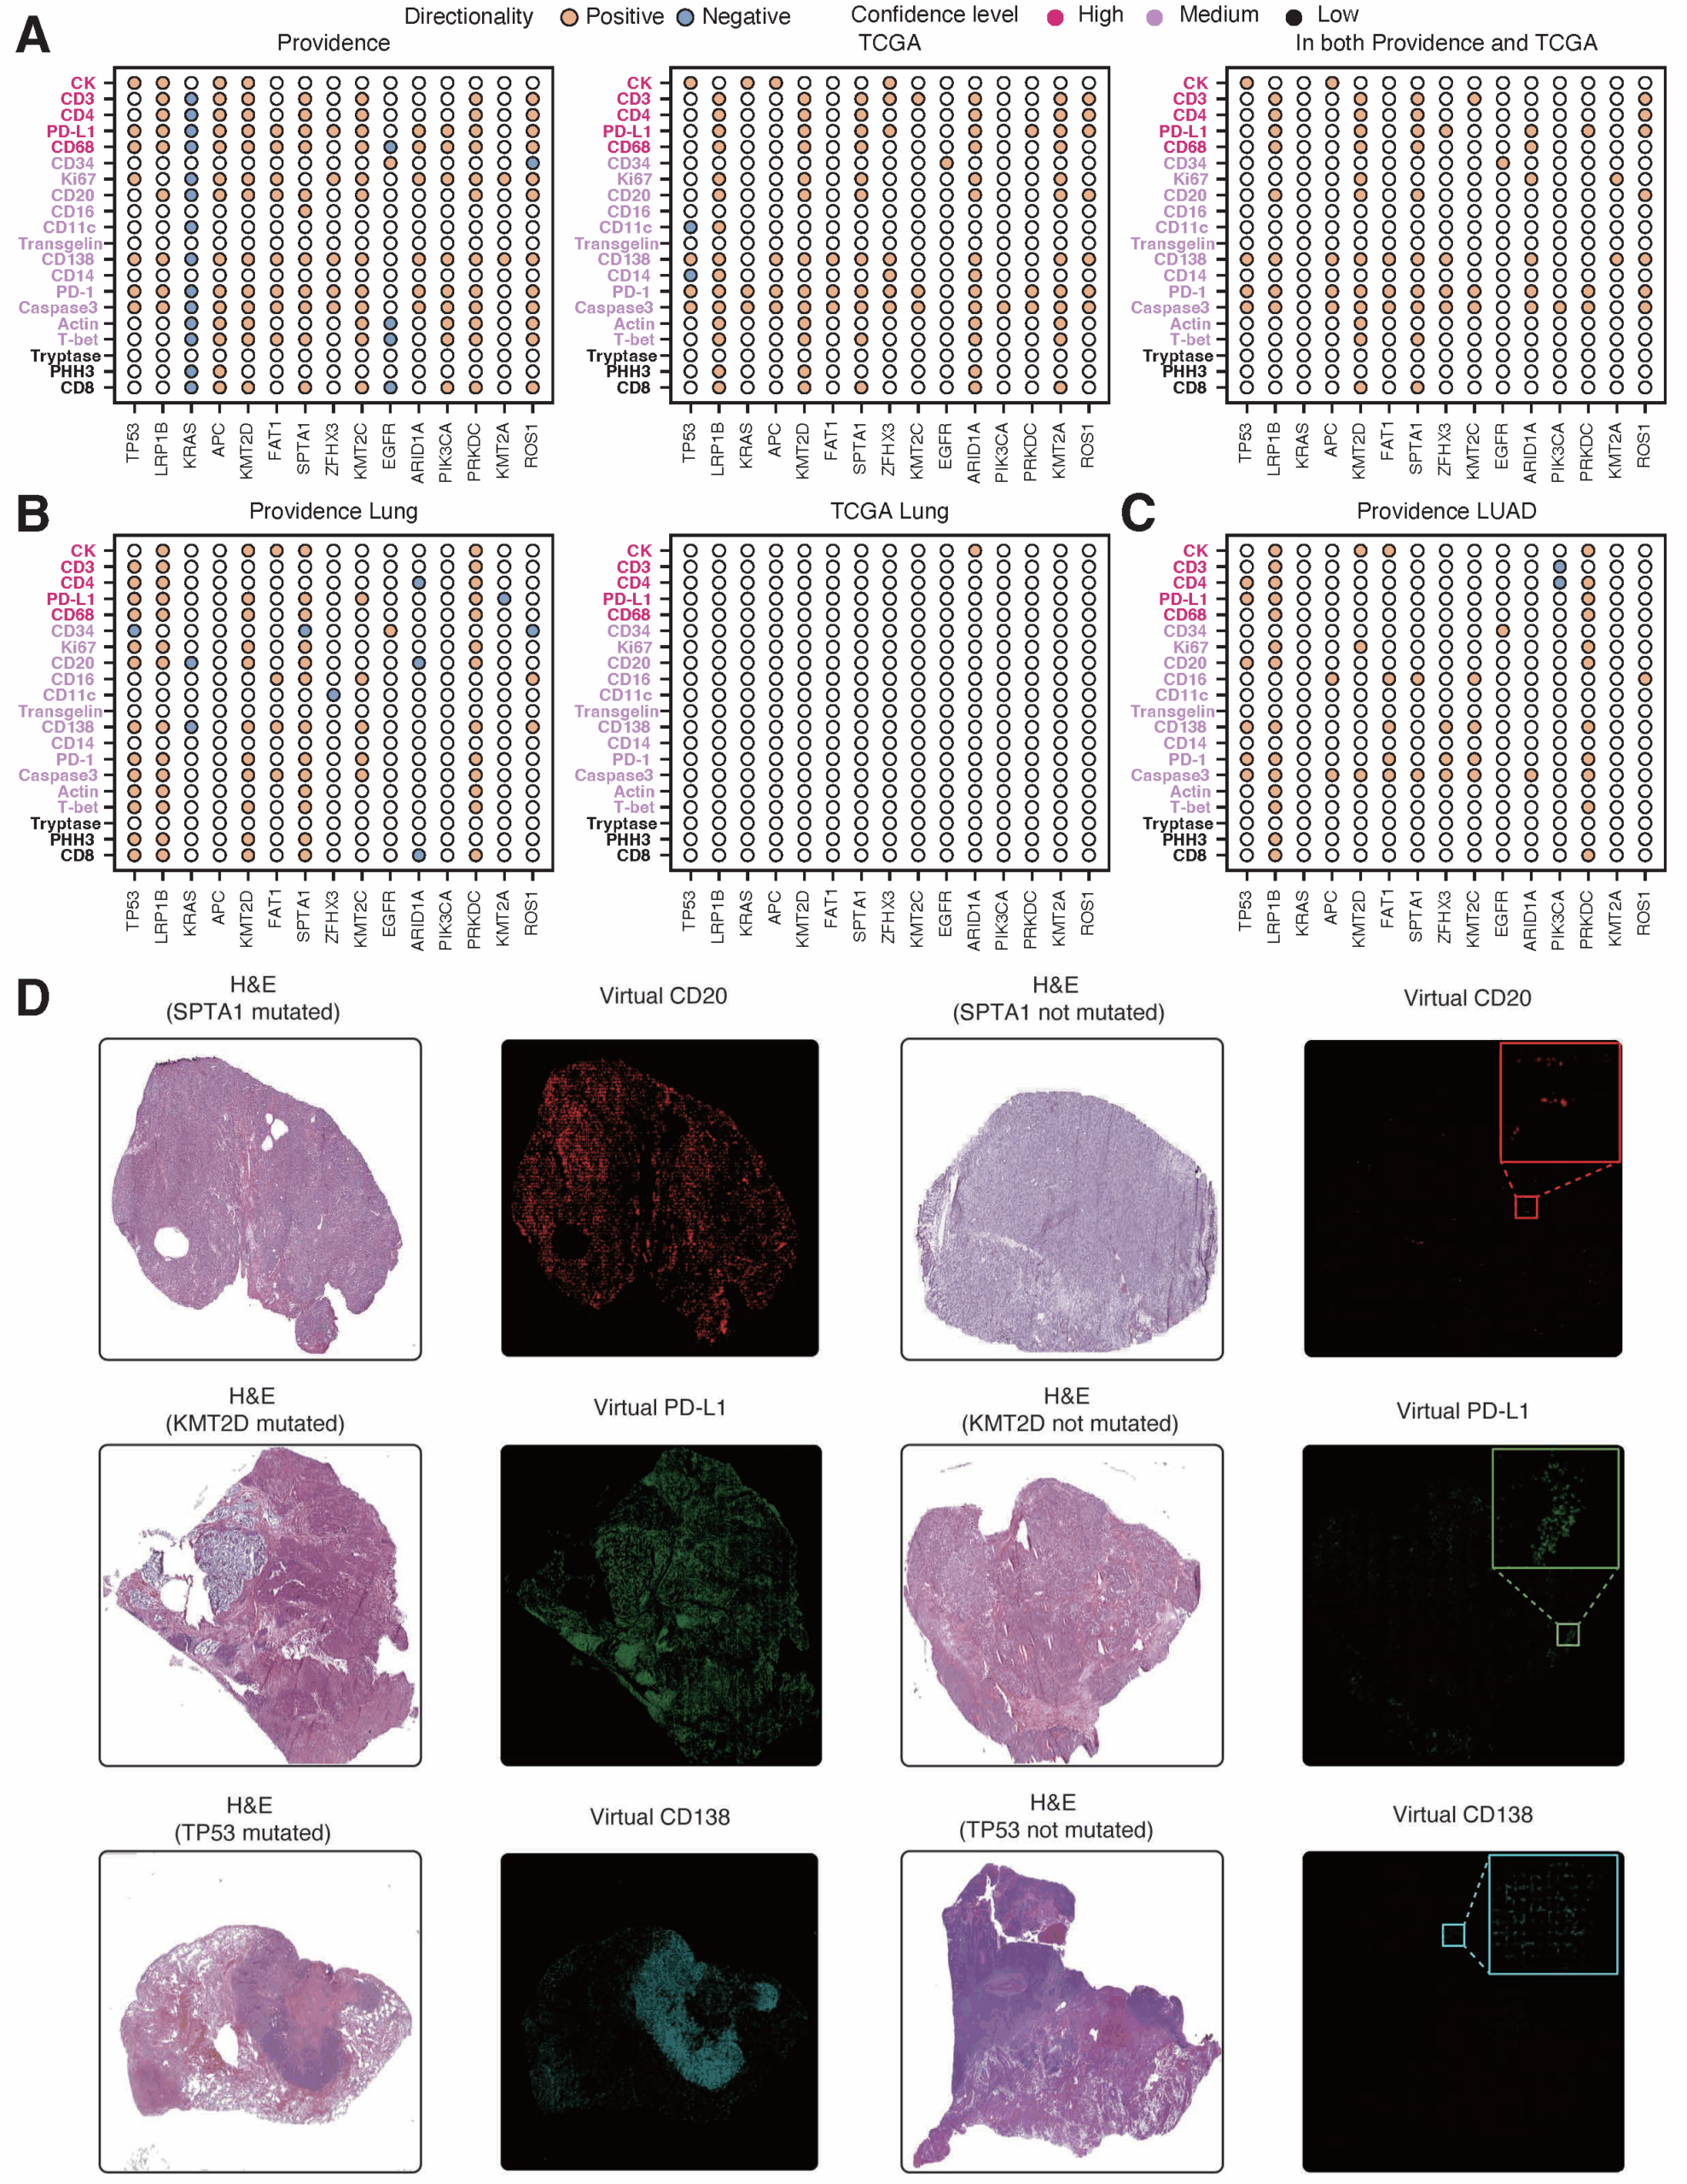
We conducted an independent external validation by applying GigaTIME to 10,200 patients in The Cancer Genome Atlas (TCGA) dataset and studied associations between GigaTIME-simulated virtual mIF and clinical biomarkers available in TCGA. We observed significant concordance across the virtual populations from Providence and TCGA, with a Spearman correlation of 0.88 for virtual protein activations across cancer subtypes. The two populations also uncovered a significant overlap of associations between GigaTIME-simulated protein activations and clinical biomarkers (Fisher’s exact test p < 2 × 10⁻⁹). On the other hand, the Providence virtual population yielded 33% more significant associations than TCGA, highlighting the value of large and diverse real-world data for clinical discovery.

GigaTIME is a promising step toward the moonshot of “virtual patient”

By learning to translate across modalities, GigaTIME is a promising step toward “learning the language of patients” for the ultimate goal of developing a “virtual patient”, a high-fidelity digital twin that could one day accurately forecast disease progression and counterfactual treatment response. By converting routinely available cell morphology data into otherwise scarce high-resolution cell states signals, GigaTIME demonstrated the potential in harnessing multimodal AI to scale real-world evidence (RWE) generation.

Going forward, growth opportunities abound. GigaTIME can be extended to handle more spatial modalities and cell-state channels. It can be integrated into advanced multimodal frameworks such as LLaVA-Med to facilitate conversational image analysis by “talking to the data.” To facilitate research in tumor microenvironment modeling, we have made GigaTIME open-source (opens in new tab) on Foundry Labs (opens in new tab) and Hugging Face (opens in new tab).

GigaTIME is a joint work with Providence and the University of Washington’s Paul G. Allen School of Computer Science & Engineering. It reflects Microsoft’s larger commitment to advancing multimodal generative AI for precision health (opens in new tab), with other exciting progress such as GigaPath, BiomedCLIP, LLaVA-Rad (opens in new tab), BiomedJourney, BiomedParse, TrialScope, Curiosity.

Paper co-authors: Jeya Maria Jose Valanarasu, Hanwen Xu, Naoto Usuyama, Chanwoo Kim, Cliff Wong, Peniel Argaw, Racheli Ben Shimol, Angela Crabtree, Kevin Matlock, Alexandra Q. Bartlett, Jaspreet Bagga, Yu Gu, Sheng Zhang, Tristan Naumann, Bernard A. Fox, Bill Wright, Ari Robicsek, Brian Piening, Carlo Bifulco, Sheng Wang, Hoifung Poon

Related publications

Continue reading

See all blog posts