
Challenge on Video Quality Enhancement for Video Conferencing
NTIRE Workshop at CVPR 2025
Dataset

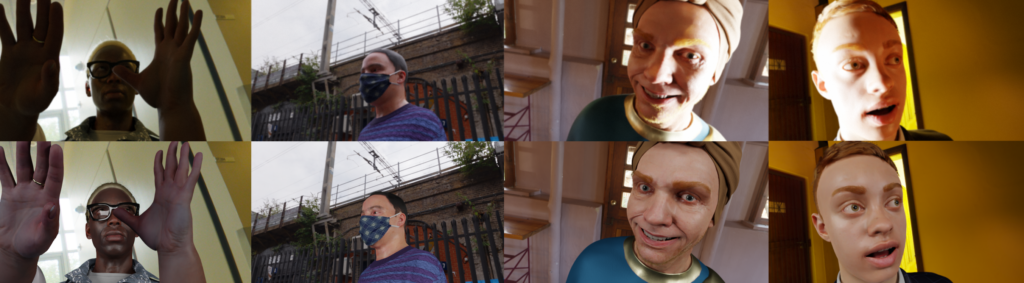
Figure 2: Ground truth from (top) our synthetics framework, (bottom) our AutoAdjust solution. The top row shows the input with suboptimal foreground illumination which is fixed by adding a studio light setup in front of the subject which is simulated in synthetics and predicted via global changes in the real data.
We provide 13,000 real videos for training, validation and testing of VQE methods. The videos are 10s long, encoded at 30 FPS and amount to a total of 3,900,000 frames. We keep 3,000 (23%) videos for testing and ranking submissions and make 10,000 (77%) available to the teams. They can choose to split it between training and validation sets as they desire. The teams are also free to use other publicly available open datasets but will have to be mindful about data drift.
In addition to this data, we also provide some paired data for supervised training as shown in Fig 2.
Note that it is possible, and encouraged, to learn a correction that is different from these ground truth labels and achieves a higher MOS score. Hence, these labels should be treated as suggestive improvements and not the global optima.
- Real data
- Of the 13,000 videos, we selected 300 high quality videos where P.910 voters vote strongly in favor of AutoAdjust. We assume these to be the ground truth.
- P.910 done on these videos shows a MOS of 3.58 in favor of the target.
- Synthetic Portrait Relighting data
- 1,500 videos for training and 500 videos for testing. 5s long encoded at 30 FPS.
- The source image only has lighting from the HDRI scene. For the target, we add 2 diffuse light sources to simulate a studio lighting setup.
- P.910 done on these videos shows a MOS of 4.06 in favor of the target indicating that these make for a better target compared to the current baseline AutoAdjust solution.
- Some examples of these pairs are shown in Fig 2. and more details about the rendering framework can be found at [3].
Dataset
train.tar.gz
train_supervised_synthetic.tar.gz
train_supervised_real.tar.gz
train_unsupervised.tar.gz
test.tar.gz
test_supervised_synthetic.tar.gz
test_unsupervised.tar.gz
Azure Blob Storage Link
Folder Structure for Dataset and Submissions
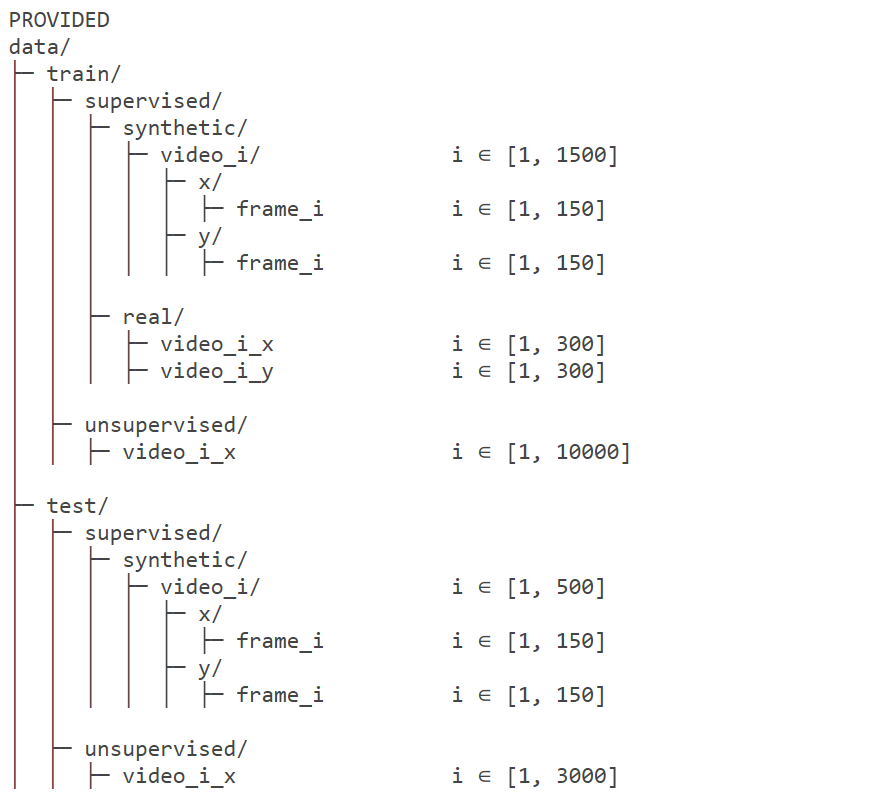
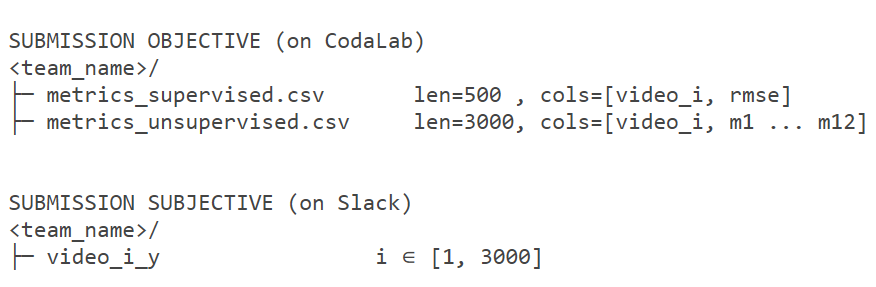
Figure 3: Folder structure for the provided dataset and the expected submissions.
To ensure efficient evaluation, please organize your submissions according to the folder structure depicted in Fig. 3. Additionally, please strictly adhere to the video coding guidelines detailed within the starter code.
Metrics & Evaluating Submissions
Our final goal is to rank submissions based on P.910 scores. We will require the teams to submit their predictions on the 3,000-video real test set. We then compare the submissions relative to the given input as well as against each other. Similar to Fig 1, comparison using the Bradley–Terry model gives us the score for each submission that maximizes the likelihood of the observed P.910 voting. Our current P.910 framework has a throughput of ~210K votes per week.
In case two methods have statistically insignificant difference in subjective scores, we will use individual objective metric discussed below to break ties.

Due to the infeasibility of getting P.910 scores in real-time, the teams can use the mean VQA score Sobj given by the provided VQA model as shown above for continuous & independent evaluation.
For the 3,000 unsupervised videos, teams are required to submit the per-video VQA score along with the 11 auxiliary scores predicted by the VQA model as shown in Fig 3. For the synthetic test set, teams should report the per-video Root Mean Squared Error (RMSE). These scores will also be published on the leaderboard so that participants can track their progress relative to other teams. However, we do not rank teams based on these objective metrics since it might be possible to learn a correction that is different from and subjectively better than the ground truth provided.
How to Submit Videos
To submit test videos for subjective evaluation, create a zip archive of all 3,000 real videos. Then, make an entry in this spreadsheet (opens in new tab) to notify the organizers of your submission. Teams can choose one of the following options:
- Upload to your own cloud storage: Upload the zip file to your Google Drive, OneDrive, or other cloud storage service. Grant read and download access to jain.varun@microsoft.com and include the link in the spreadsheet.
- Upload to Azure Storage using azcopy: This option allows you to avoid using your own cloud storage. Refer to this link (opens in new tab) for instructions on installing the azcopy command-line interface (CLI) tool.
- Upload your file:
azcopy cp --check-length=false team_name.zip "https://ic3midata.blob.core.windows.net/cvpr-2025-ntire-vqe/final/?sv=2023-01-03&st=2025-02-19T06%3A25%3A24Z&se=2025-05-01T05%3A25%3A00Z&sr=c&sp=wl&sig=34%2Ff%2BtkD8hYYVD1u4d00m0PSnW%2Fkn5XhOByFqWnhZDA%3D" - To check your submission:
azcopy ls "https://ic3midata.blob.core.windows.net/cvpr-2025-ntire-vqe?sv=2023-01-03&st=2025-02-19T06%3A25%3A24Z&se=2025-05-01T05%3A25%3A00Z&sr=c&sp=wl&sig=34%2Ff%2BtkD8hYYVD1u4d00m0PSnW%2Fkn5XhOByFqWnhZDA%3D"
- Upload your file: