
As technology has advanced, the way we accomplish things in our lives has shifted. While new tech is influencing such basic human activities as communication, for instance, encouraging us to reconsider what it means to connect with one another, technological innovations are also changing approaches to building tech itself. Cloud computing has enabled people, including those developing technology, to be more flexible about how and where they work, loosening their ties to local computers and workstations, while the availability of growing amounts of data has spurred new ways of gaining insights about the problems that need to be solved. Together, these developments have created a new work style, especially when it comes to data science. Data scientists are interested in prototyping and tinkering, simultaneously coding, exploring data, and identifying patterns and relationships through visualizations. Unlike software engineers, for whom the programming is the artifact, data scientists may be using coding as a means to answer bigger questions around understanding data, modeling data, and building models. Conventional programming tools don’t automatically transfer to this new environment.
Established programming tools that have found success in the software engineering space, however, aren’t without value when it comes to this interactive way of working. They provide a launching pad: Why does a technique that works for software engineers not work for data scientists? We investigated this question and used the answers to guide us in reinventing the traditional tools of program slicing and programming-by-example for a data science crowd. We set our sights specifically on the computational notebook, a popular programming and data analysis platform among data scientists. In a series of papers that received recognition from the ACM CHI Conference on Human Factors in Computing Systems (CHI) this year and last, we seek to improve the notebook experience so data scientists can focus on leveraging their expertise instead of being derailed by the “clerical work” that has come to define the notebook experience.
Computational notebooks—the pain points
PODCAST SERIES

The AI Revolution in Medicine, Revisited
Join Microsoft’s Peter Lee on a journey to discover how AI is impacting healthcare and what it means for the future of medicine.
Although computational notebooks were originally intended for exploratory work, data scientists are now orchestrating more of their activities with them—in some cases, even using notebooks directly in production. However, this increase in scope has led to difficulties that negatively affect data scientists’ productivity, prevent them from accomplishing tasks the way they’d like, and result in an overall frustrating experience. Understanding how these pain points emerge and impact data scientists can inform the design of innovative tools that can substantially improve the data scientist user experience.
To learn about these pain points, we conducted multiple studies, including interviews and field studies, with professional data scientists who routinely use computational notebooks. We present our findings across three papers: “What’s Wrong with Computational Notebooks? Pain Points, Needs, and Design Opportunities” (CHI 2020 (opens in new tab) honorable mention); “Wrex: A Unified Programming-by-Example Interaction for Synthesizing Readable Code for Data Scientists” (CHI 2020 best paper), and “Managing Messes in Computational Notebooks” (CHI 2019 (opens in new tab) best paper).
In “What’s Wrong with Computational Notebooks,” we conducted semi-structured interviews, followed by a survey with over 150 data scientists, and identified nine pain points spanning their workflow:
- Setup: Creating their notebooks and bringing in new data
- Exploration and analysis: Iterating over data, models, and visualizations
- Code management: Managing package dependencies and writing code
- Reliability: Scaling their notebooks to larger datasets
- Archiving: Preserving history within and between notebooks
- Security: Masking sensitive data and controlling access
- Sharing and collaboration: Collaborating in real time and sharing with non-data scientists
- Reproduction and reuse: Replicating or reusing the results of notebooks
- Notebooks as products: Translating notebooks to production
In conducting the studies across the three papers, we were surprised by how often the different activities data scientists performed in their notebooks conflicted with one another. First, while data scientists appreciated the ability to quickly perform exploratory data science within the notebooks, doing so made the activity of reasoning about data and refactoring, or transforming and restructuring code, much more challenging. This scenario speaks to the pain points of code management, sharing and collaboration, and reproduction and reuse. Second, although data scientists appreciated being able to simultaneously work with both code and data, they found transforming data in the notebook to be challenging and cumbersome, reflective of the setup and exploration and analysis pain points. As part of a broader goal to improve computational notebooks, we built two tools to address these pain points.
Wrex: Lead by example
Getting data into a format that can be used for modeling, prediction, and other analysis tasks can be a large part of a data scientist’s job. This preparation, known as data wrangling, takes up time and effort that could be better spent gaining insights from the data being prepped.
In our “Wrex: A Unified Programming-by-Example Interaction for Synthesizing Readable Code for Data Scientists” paper, we interviewed data scientists who regularly use notebooks about how they currently wrangle data and their experience using existing wrangling tools, identifying features they needed to better accomplish the task. We found that data scientists don’t want to leave their preferred notebooks to do data wrangling; toggling between notebooks and searching for suitable code online slows progress. They want transparency, indicating the importance of being able to see the code behind the transformation—to understand how a given tool arrived at the transformation—so they could verify and more easily reuse the code. In addition, data scientists preferred their data wrangling logic to be written using the familiar data science languages they were already using, such as Python and R.
To support these needs, we designed Wrex. As we describe in our paper, Wrex “automatically displays an interactive grid when a code cell returns a tabular data structure, such as a data frame. Using programming-by-example, data scientists can provide examples to the system on the data transform they intend to perform. From these examples, Wrex generates readable code in Python.” There are wrangling tools available that use programming-by-example, but generally, they don’t meet all the data scientist needs we identified, which is ultimately what drove our design. Previously, the types of programming-by-example displayed by Wrex have been used on small amounts of data in settings such as Microsoft Excel, but with Wrex, data scientists are able to “synthesize code on subsets of their data and to apply this code to other, larger datasets. The synthesized code can be incorporated into existing data pipelines.”
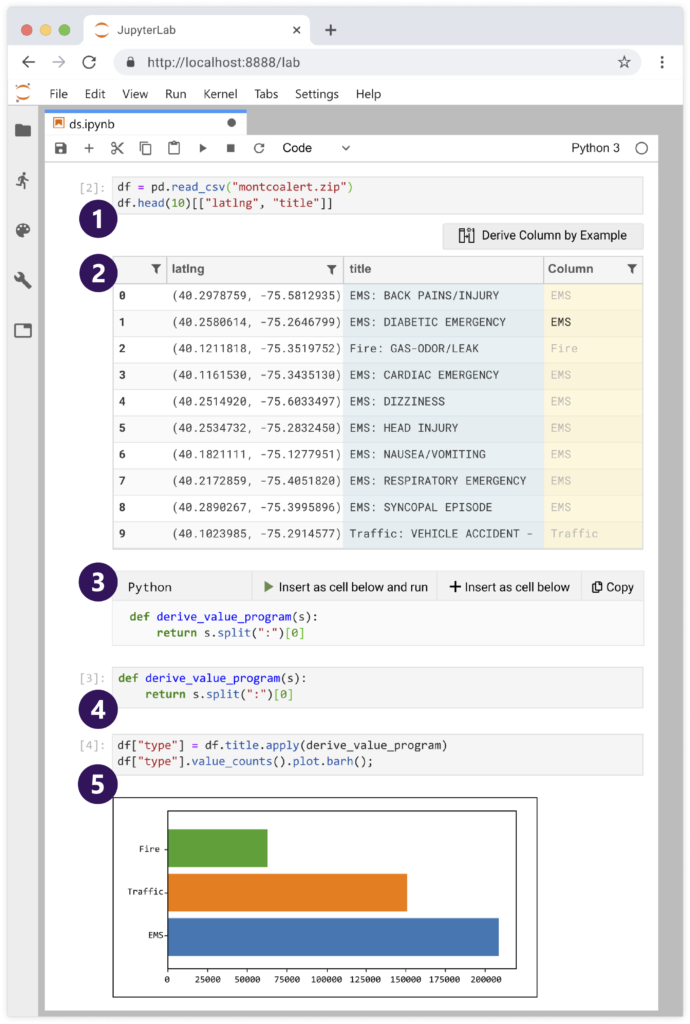
Wrex, a programming-by-example environment that supports code transformations in computational notebooks, is intuitive to use. (1) A data frame is created with a user’s dataset and is sampled. (2) The user can derive one or more new columns and give data transformation examples in Wrex’s interactive grid. (3) The synthesized code generated from the grid interactions appears in Wrex’s code window. (4) Synthesized code is inserted into a new input cell. (5) The synthesized code is applied to the full data frame and the results are plotted.
Using Wrex is intuitive. First, users create a data frame within their dataset and sample it. In contrast to typical read-only preview provided in notebooks, Wrex displays an interactive grid in which users can derive a new column from the existing columns and give data transformation examples in a natural way. For instance, given a column called “title” with a record like “FIRE: GAS-DOOR/LEAK,” a data scientist can give an example of how they want to transform this data. For instance, they might simply type “FIRE” to indicate to Wrex that they want the category before “:”. By doing so, Wrex then provides the data scientist with a provisional cell; this is an intermediate cell that contains a code snippet corresponding to their intention, such as “s.split(“:”)[0]”—split the string “s” at the “:” character and take the first word.
Implementing Wrex
To implement programming-by-example in notebooks, we chose Microsoft Program Synthesis using Examples SDK (PROSE SDK) (opens in new tab) and the algorithm behind the Flash Fill feature available in Excel (opens in new tab). Flash Fill synthesizes programs in an underlying domain-specific language to handle a variety of transformations with just a few input-output examples; no code writing is required on the part of Excel users. Flash Fill and many existing systems in programming-by-example are opaque: The systems perform data transformations, but don’t reveal the underlying logic used to do the transformation. PROSE extends the Flash Fill algorithm to accommodate data scientists’ desire for readability. (For a demo of an early design of Wrex, as well as other program synthesis technologies in action, check out this video on notebooks and program synthesis (opens in new tab), and to learn more about Flash Fill, listen to this podcast on program synthesis and the art of programming.)
Our insight with Wrex was that by exposing the internal program as code, we could repurpose programming-by-example to help data scientists write code in notebooks. Doing this required several innovations and advancements since the programs generated by these systems are typically not intended to be viewed by users. To accomplish this, we developed a four-phase readable code synthesis (RCS) algorithm to produce code in a programming language that’s already familiar to data scientists. This algorithm can generate code for a variety of common data science tasks, including extraction, case manipulation, rounding, scaling, formatting, and point composition.
In an in-lab user study during which data scientists were asked to complete a set of tasks with and without Wrex, participants reported a boost in their productivity with the tool, as Wrex eased the burden of having to recall or look up data transform functions. Moreover, having data transformations as readable code increased their trust and confidence in the wrangling tool. Finally, as we say in the paper, “inserting synthesized code as cells is useful and fits naturally with the way data scientists already work.”
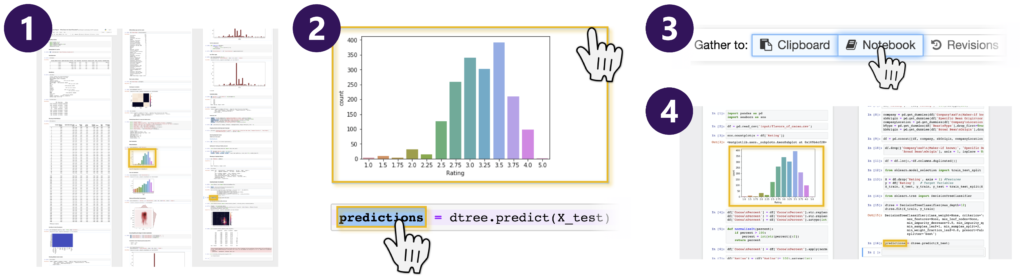
A notebook extension, Gather is a set of interactive tools designed to help data scientists more easily find, clean, and compare code in a cluttered notebook (1). With code gathering tools, a data scientist can select results such as charts, tables, and other code output (2) and click “Gather to Notebook” (3) to obtain a minimal, complete, ordered slice that replicates the selected results (4).
Gathering tools: Managing messes, post-mess
While Wrex supports data scientists in creating code, our second tool helps clean up the code when data scientists realize they no longer need or want it, especially given that for data scientists, computational notebook use is more about the exploration and problem-solving (opens in new tab) than having high-quality code to show for it at the end of their journeys. This matters for several reasons. As we explain in our “Managing Messes in Computational Notebooks” paper:
Poor code quality takes on a spatial dimension. Messes accrue and disappear in an iterative process of expansion and reduction of code: [Data scientists] write code in many small cells to try out different approaches to solve a problem, view output from their code, and debug their code. … Eventually, messes get in the way of data analysis. It becomes difficult to understand analyses split across many cells of a notebook, and long notebooks become time-consuming to navigate. Important results accidentally get overwritten or deleted. While [data scientists] often wish to share their findings with others, they are often reluctant to do so until they have cleaned their code.
Currently, data scientists rely on a variety of makeshift solutions to organize their code—from deleting or merging cells, to copying important code to a separate document, to abandoning an unwieldy notebook in favor of a new one. To streamline the process, we offer a notebook extension called Gather, a set of interactive tools designed to help data scientists more easily find, clean, and compare code. In interviews with data scientists and developers of data analysis tools, we found code management and organization to be a matter of personal preference. Because of that, we designed Gather so that it could be used even if a data scientist spent little or no time organizing or versioning their code in advance. Gather allows for post-hoc mess management.
Our insight in implementing Gather was to repurpose a classic static program analysis technique called program slicing. Traditionally, program slicing has been used to diagnose bugs in programs. With this technique, the programmer chooses a line of code in which the bug can be observed. Then, program slicing makes a smaller version of the program by removing parts of the source code that don’t affect the programmer’s chosen line, creating a “slice.” With nonessential code removed, the programmer is more easily able to determine why the bug in their code is happening. Our insight for computational notebooks is that managing messes has similar needs, even though the task is no longer debugging. For instance, a data scientist might have created a plot in their notebook. Some of the code they wrote is required to generate this plot, but other parts of the code they’ve written may have been for a different plot or something else entirely.
Notebooks become a proliferation of code cells alongside corresponding output cells containing their results. In using Gather, a data scientist selects a “slicing criterion,” which can be a variable in a code cell or an output cell. Our adapted program slicing technique computes the subset of program statements—the slice—that affects the value of the variables or the output of that target selection, taking into account the order in which the data scientist has executed those cells. Since slicing discards code unrelated to the slicing criterion, this leads to a cleaner, more relevant, and easier-to-understand notebook.
Design opportunities
Through the user studies we conducted across these three papers, we obtained a richer picture of how data scientists use computational notebooks, specifically gaining a clearer understanding of the process of managing messes and the value of wrangling tools that support readable code and that can be executed within the notebook environments of data scientists’ choice. Our broader look at pain points opens the door to a variety of design opportunities related to such notebook activities as refactoring, deploying to production, and long-running computations.
Computational notebooks are an ideal area in which to research and study the unique blend of rich interactivity undertaken by those who work with code, data, and visualizations. Such a platform is ready for additional innovation and encourages us to revisit old techniques, reapplying or adapting them in new ways to support the changing landscape of how people develop software.