

By Laura Pomeroy (opens in new tab)
Image credit: Unsplash
“The value of an idea lies in the using of it.” – Thomas Edison
Does your team have what seems like a million ideas for improving the product? Does your product backlog feel endless? The first step to using an idea is knowing which idea to use. It is important to learn which ideas will bring the most value to your customers before choosing what to focus on. One method that can be used to help is called the Kano model.
What is the Kano model?
Kano (pronounced “Kah-no”) model is a theory for product development and customer satisfaction. This theory gets its name from Noriaki Kano who developed it in the 1980s. Kano believed in three fundamentals:
- Customer satisfaction of a feature depends on the level of functionality.
- Customer loyalty is dependent on five emotional response types: must-be, performance, attractive, indifferent, and reverse.
- Customer satisfaction with how someone feels about a feature can be measured in a questionnaire.
To demonstrate the power of this quantitative methodology, we gathered some of the world’s most popular and least popular foods. Surveying 20 people for demonstrative purposes, we learned which foods provide people with the most satisfaction and which foods people could live without. If popular foods around the world were features in your backlog, here is what you should focus on first:

Customer satisfaction and functionality
Measurement scales of satisfaction and functionality are used in the model for understanding a customer’s emotional response to a feature. The satisfaction scale goes from frustrated (no satisfaction) to delighted (high satisfaction). The functionality scale represents the level of functionality the customer thinks a feature provides. It goes from none (no functionality) to best (well-implemented).

An important note on satisfaction and functionality: Kano model is a good ‘taste test’ for understanding the value of a new idea but should not be the only method used to make investment decisions. Imagine you have invented a new ice cream flavor that combines chocolate, caramel, and coconut. If it scored high using this methodology but does not taste good, it will not have as much value to customers once released. If features score high using Kano, further testing and experimentation are recommended.
The five emotional response types
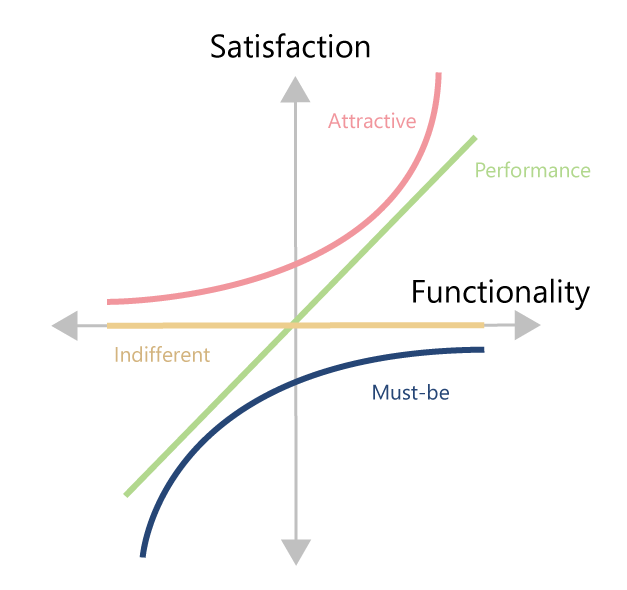
- Must-be (or must have): Those features that are just expected; or basic expectations. If we leave them out, our product will be considered bad or insufficient. These features should be prioritized first. In our food survey, tomatoes were rated as a must-be. Tomatoes are a staple ingredient. They do not make people particularly happy but lacking them would make people very upset.
- Performance, also known as one-dimensional: These tend to have a direct impact on satisfaction if the functionality, performance, or in our example, ‘flavor’ meets customer expectations! People like these features and would dislike not having them. These should be prioritized second, right after must-be features.
- Attractive (sometimes called delighter): Features that are unexpected and cause a positive reaction. Over time, attractive features can become performance features as satisfaction settles and the loss if absent becomes greater. For example, when first invented, ice cream may have been in the attractive category, shifting over time to the performance category as its novelty wore off.
An important note: Unlike our food survey example, Kano model results typically have many features in the attractive category. These features should be prioritized after must-be and performance features and before indifferent features. - Indifferent: The presence (or absence) of these features does not make a real difference to customer satisfaction with the product, no matter how much work we put into them.
- Reverse (undesired): These features lead to customer satisfaction by NOT being there. Do not build these ideas. If liver was a feature, do not build it!
The questionnaire
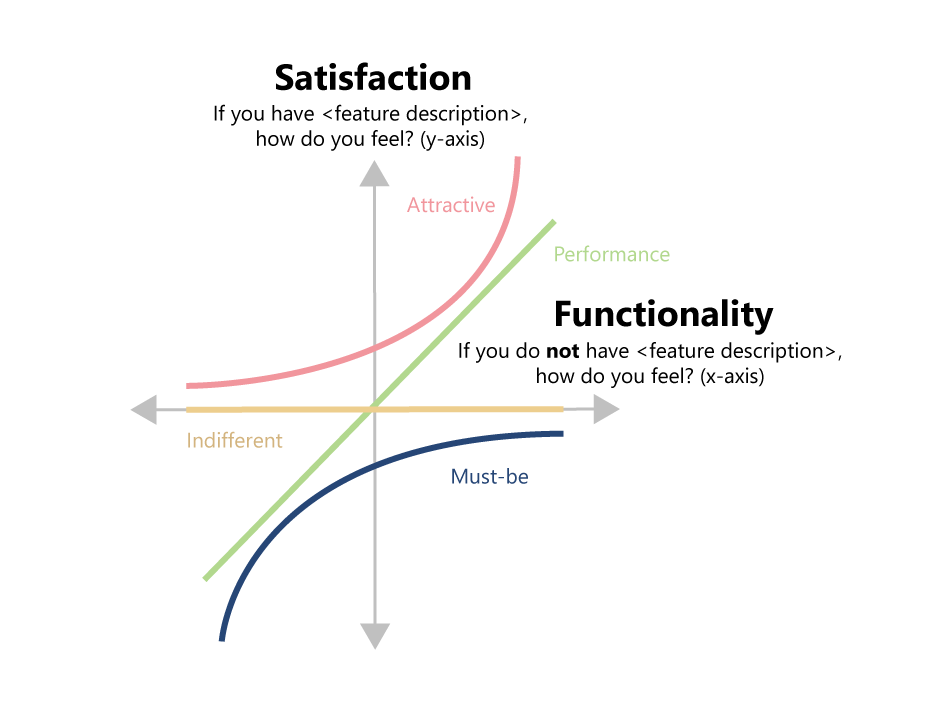
Kano uses a two-question pairing with a five-point non-linear scale to reveal our customers’ perceptions of the features. These can be presented using images, video, GIFs, or text descriptions. The two primary questions are:
- If you have (insert feature description here), how do you feel?
- If you do not have (insert feature description here), how do you feel?
Additionally, this two-question pairing helps with a frequent problem in research studies where people say they want everything. Kano helps tackle that problem by measuring the dissatisfaction if the person did not have the feature.
When plotted, the presence of the feature (satisfaction) is on the y-axis and the absence (functionality) is on the x-axis:
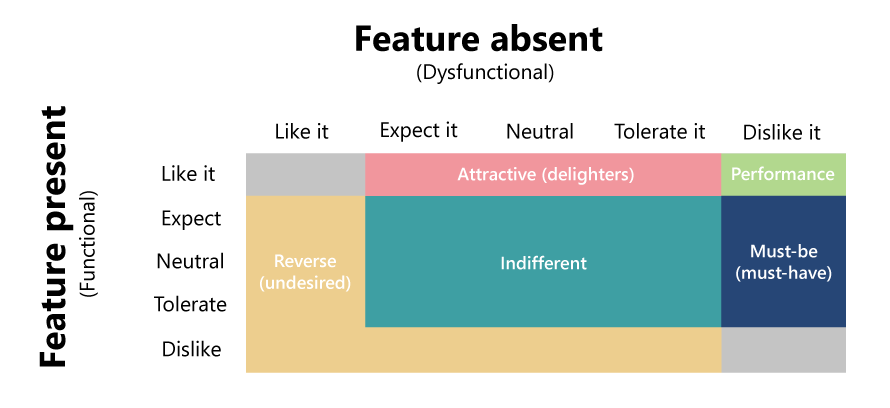
Question and answer phrasing can vary and should be tested to check that customers understand the intention. To learn more about this topic, we recommend reading The Complete Guide to Kano (opens in new tab). Example responses are as follows:
- I like it
- I expect it
- I am neutral
- I can tolerate it
- I dislike it
In our demonstrative food survey, we used the following question and response phrasing:
- If you [could/could never] eat pizza anytime you wanted for the rest of your life, how would you feel?
- I would like it
- It is a basic necessity/I expect it that way
- I am neutral
- I could tolerate it
- I would dislike it
The following chart shows how each question-and-answer pair places the feature in a category:
When plotted, our food Kano model results look like this:

What can the Kano model be used for?
- Concept value testing – This is the most common application for the Kano model. It can help bring clarity to which new features should be included in the product roadmap. This methodology can be used to get a sense of what value new concepts could bring to customers.
- Improving and prioritizing existing features – If your backlog is full of ideas for improving existing features, the Kano model can help you know what to work on first.
Tip: Adding an open-ended question can help you learn why people rated each feature the way they did, and the responses can be used to improve each feature. - Benchmarking – Kano model measures satisfaction and functionality at a point in time. This can be used later to see how a feature has changed in performance.
- Upsell – The information gathered about which features provide the most satisfaction to customers can be used in marketing, upsell strategies, and even inform subscription models.
- Comparing user segments – Kano model can be used to compare preferences between different customer segments. For example, you could compare which features could lead to higher satisfaction for students versus consumers.
We hope this article has given you a good overview of the Kano model and that it will help you take the first step in bringing the right ideas to life!
Sources:
Kano analysis: The kano model explained // Qualtrics (opens in new tab)
Laura Pomeroy leads user research studies for Microsoft Word with a primary focus in the writing intelligence space. In collaboration with designers and program managers, we work hard to turn insights into informed product designs and decisions. Let’s make the world a better place for all.