

Introduction
Data plays a vital role in the lifecycle of every single product in the technology industry. With data, we can generate insights to improve products and provide a superior customer experience. Yet insights are only actionable if they are derived from trustworthy data. For example, a navigation app relies on accurate location detection data to provide directions to users.
Data quality is especially important when it comes to A/B testing. A/B testing allows us to evaluate a feature from different perspectives and make informed decisions. Yet unreliable data can lead to erroneous analysis and poor decision-making that ultimately harms the user experience or other key metrics. Fortunately, there are tools and methodologies that we can use to ensure that we are relying on quality data to produce trustworthy A/B testing analyses.
In this blog post, we will explore these resources in more detail and answer the following questions:
- How can data quality impact our A/B testing results?
- What are the critical data quality requirements for A/B testing?
- How can we continuously monitor data quality?
How can data quality impact our A/B testing results?
A/B testing results are only reliable and actionable if they are based on complete and accurate data. But how do we know that the data that we are using is reliable? The following are several signs of data quality issues in A/B testing to watch out for.
Sample Ratio Mismatch
SRM (Sample Ratio Mismatch) means that the observed traffic allocated to treatment and control variants are different from the ways that they are configured. When this occurs, it can lead to selection bias. Analyses that have SRMs are generally viewed as untrustworthy and should not be used to make a decision (opens in new tab) . There are many scenarios where data quality issues can lead to an SRM. For example, the incomplete logging of treatment/control assignment information in telemetry, or the unbalanced telemetry loss for treatment versus control.
STEDI of metrics
A/B metrics should be Sensitive, Trustworthy, Efficient, Debuggable, and Interpretable (STEDI) to help the experimenter understand the treatment effect and interpret the metric movements that are observed. Poor data quality can negatively impact metric sensitivity and trustworthiness.
Sensitivity: If a data field has a very high missing rate, then metrics that are conditional calculations based on this data field will have a very low sample size. In this scenario, the hypothesis tests on these metrics will lack power.
Outliers are another common issue that can negatively impact sensitivity. Outliers increase the variance and small numbers of severe outliers can introduce huge noise that can move metrics.
Trustworthiness: Metrics that utilize missing data may have incorrect statistics and untrustworthy hypothesis test results. And it can be more concerning when the missing rate is not balanced between treatment and control. There are several reasons why data may be missing. For instance, failed processing or incomplete data extraction. In the context of retention analysis, missing data can make it look as if a customer churned when they did not, causing the retention rate metric to appear lower.
When an in-depth analysis is needed for various segments of the population and when the fields used for segmentation are inaccurate or have a high missing rate, results based on these segments can be misleading.
Latency in analysis result delivery and delayed decision-making
Statistical analysis relies on complete data. In software products, it is common to observe delays between data generation and data readiness for analysis. For example, if we need input from multiple data sources to test a hypothesis, the time to wait for the availability of all the data could be substantial. Delayed analysis may lead to delayed decision-making. Consequently, we may not detect or rectify unexpected regressions in product experience as promptly as desired. To mitigate this, well-designed data pipelines that meet the required Service Level Agreements for its availability are critical.

Figure 1: common data quality dimensions
What are the critical data quality requirements for A/B testing?
As shown in Figure 1 above, common data quality dimensions include completeness, uniqueness, timeliness, validity, integrity, consistency, relevance, compliance, and retention.
We have seen many instances where data quality varies across A/B testing scenarios. For instance, a bug in a new feature that increases invalid values. These instances highlight the importance of data quality metrics in the A/B testing process.
We can use the following checklist to set up additional metrics to measure data quality in our analysis:
- Missing rates: How much data is missing from each column of interest? Is there any pattern, such as a dummy value representing missing values?
- Invalid values: Do the values follow the proper format? Are the values valid for this column?
- Join rates: Are the join rates high enough if we are joining data from different sources?
- Uniqueness: Are there duplicates of the same row? Is there more than one column for the same signal?
- Data delays: What’s the proportion of data available at the time of computation? How long does it take between when the events were logged and when the data is available for analysis?
In addition to the above list, we should of course ensure that we are complying with data policy including retention periods and privacy requirements.
Now let’s take a look at several data fields we should pay extra attention to before analyzing A/B testing results.
Randomization unit
Randomization unit is the unit on which we randomly assign treatment and control. Common randomization units include users, sessions, pages, impressions, devices, cookies, documents, etc. A data quality check must help to ensure that the data belonging to the same randomization unit are linked in an accurate and compliant manner.
It is important to always check for missing rates and patterns of the columns which we consider as randomization units. Missing data can appear as nulls, empty strings, zeros, infinity, or default values. Missing data can come from a specific data source due to logging issues or may be introduced in the data cooking pipeline. For example, we may detect missing data from a certain build version or from one data source which has partial delays. In some instances, we may analyze A/B testing data on multiple aggregation levels (aggregation levels are likely represented by the same columns of randomization units), such as sessions and users (a user can have multiple sessions). We should then check whether all the aggregation level columns are present.
Treatment assignment
Treatment assignment information is necessary to differentiate the data between treatment and control to compare the efficacy of the tested feature. A column containing treatment assignment information should always be present in the data that is used for analysis. And it’s better to ensure that the treatment assignment information follows a consistent format, both within the same data source and across multiple data sources if there is a need to join them together.
Sometimes, we can add additional information to treatment assignment information. We can then use it to separate different traffic. For example, when we expand an experiment to another audience, we can add the audience itself to filter the data between groups in the analysis.
In addition, treatment assignment should be consistent for the randomization unit (i.e, users) through the analysis. For instance, if we assign a user to a treatment group she should not appear in the control group.
Timestamp
When running an A/B test, we need to keep track of the time when an event of interest occurs. So, there should always be a column representing timestamps of the events. Timestamps play an important role in filtering events that are included in an analysis and in deciding the sequence of events for a triggered analysis (A/B tests that are analyzed on a subset of the assigned population – a triggered A/B analysis). We should also check for missing rates and filter out values such as a default datetime 1900-01-01 and datetime in the future.
It is important to carefully consider selecting an appropriate time to support the aforementioned use cases, preferably in the context of the product. Typically, there are at least two timestamps to choose from. These include the time the activity occurred and the time when the corresponding log is received. For web-based server-side A/B tests, the time difference is likely to be insignificant and the activity ordering remains unchanged. However, for client-side A/B tests, these two timestamps can be quite different. Deciding which one to use will be a subjective trade-off taken by the product team. From previous experience, client returned timestamps are often notoriously noisy. We would highly recommend using timestamps when receiving the log rather than the client-logged timestamps. Below is an example of how device recorded event time (client time) can differ drastically from the correct event time.
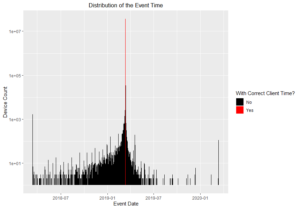
Figure 2: Distribution of the event time with device count
Segments
We frequently slice data into subgroups for analysis. We call these subgroups segments and we define them at various levels of aggregation. Segments can be on row-level or if applicable and desired, on randomization unit level. For example, if our A/B test is randomized on user level, we can have a date segment on row-level as well as a user age group segment on user level. Some common segments include date, market, browser, application version, etc.
Columns used as segments should be with the right format, with acceptable missing rates and of reasonable cardinality. A heuristic reasonable range of cardinality is 2 to 10. One with a constant value provides no additional insight. One with hundreds of distinct values may result in a broad range of issues such as slow computation, low statistical power, and/or loading or responsiveness issues with visualization. Such segments can create even a larger number of subgroups, especially if we pair it with another segment with high cardinality. If the segment column naturally comes with high cardinality (e.g., language), a commonly adopted practice is to truncate the list to the Top N with the highest frequencies and cast the rest to “Others”.
How can we continuously monitor data quality?
Data quality changes as the product and data sources evolve over time. Adding new logs, accommodating new data sources, following new requirements for data governance, will all potentially impact data quality. There are multiple tools that we can use to help keep track of data quality measurements.
- Dashboard for data quality metrics. This requires periodical ingestion of data. The ingestion can be on hourly, daily, weekly, or a customized frequency. It depends on how frequently the data quality is likely to change and the computation and storage cost budget.
- Alerting on anomalies. Setting up alerts on anomalies can help detect abnormal changes in data quality metrics. This can indicate abnormal activities in the source data or processing pipelines.
- Segment data quality metrics. Data quality metrics should be calculated based on the same segments just like regular metrics. Sometimes a significant data quality drop can occur within a segment while overall there may be little difference.
- A/A test. An A/A test (opens in new tab) is an A/B test with an identical experience in control and treatment variants. Running A/A tests is a recommended approach for an end-to-end test of an A/B testing system, and often it can also help uncover data quality issues. We expect an A/A test to have balanced traffic split between variants, with no statistically significant changes on metrics. When there is SRM or unexpected metric movements, it is likely due to the telemetry or data pipeline implementation issues.
Below is a real example that illustrates how the team uses the first 3 tools for monitoring. The dashboard (the blue line) shows the value change of a data quality metric across time. And the red points highlight the anomalies that will trigger the alerts to the product team. To ensure the data quality of subgroups, the team also sets up the same dashboard for segments such as market and OS version.
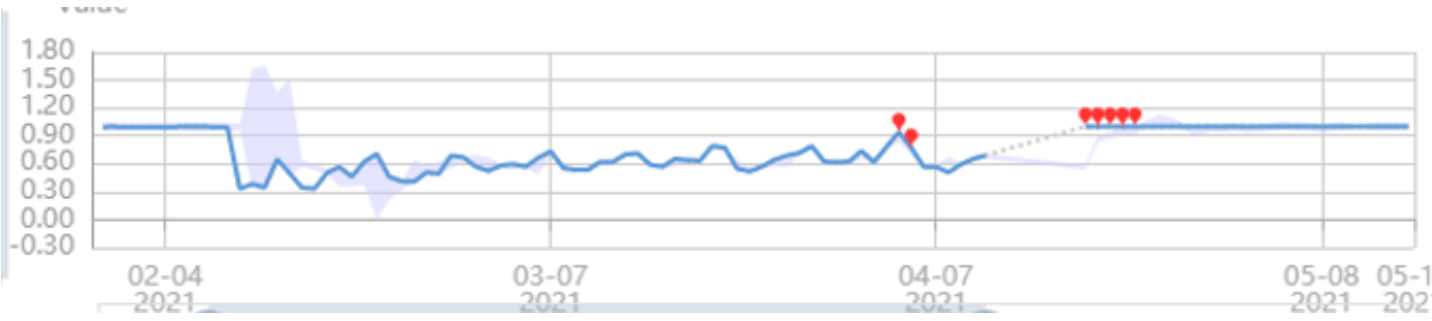
Figure 3 : Continuous data quality monitoring
Summary
High-quality data is a fundamental building block for trustworthy A/B testing results. Data quality issues can produce unreliable A/B testing results. This can negatively impact A/B testing analysis and decision–making. By utilizing the checklists and the requirements for critical data fields, we get ready to implement checks on critical components of A/B testing data. When we set up the data quality check monitors, we always adopt the four tools for continuous monitoring as mentioned above. We hope this blog post can help you produce the best-qualified building blocks for your A/B testing.
– Platina Liu, Wen Qin, Hao Ai, Jing Jin, Microsoft Experimentation Platform
References:
[1] A. Fabijan et al., “Diagnosing Sample Ratio Mismatch in A/B Testing.” https://www.microsoft.com/en-us/research/group/experimentation-platform-exp/articles/diagnosing-sample-ratio-mismatch-in-a-b-testing/
[2] R. Kohavi, D. Tang, and Y. Xu, Trustworthy Online Controlled Experiments: A Practical Guide to A/B Testing. Cambridge University Press, 2020.
[3] W. Machmouchi, S. Gupta, and R. Zhang, “Patterns of Trustworthy Experimentation: During-Experiment Stage.” https://www.microsoft.com/en-us/research/group/experimentation-platform-exp/articles/patterns-of-trustworthy-experimentation-during-experiment-stage/
[4] Janhavie, “Data Quality.” https://medium.com/datacrat/data-quality-dc4018fc443
[5] Lean-Data, “Here is how to start with data quality.” https://www.lean-data.nl/data-quality/here-is-how-to-start-with-data-quality/
[6] T. Crook, B. Frasca, R. Kohavi, and R. Longbotham, “Seven pitfalls to avoid when running controlled experiments on the web,” in Proceedings of the 15th ACM SIGKDD international conference on Knowledge discovery and data mining – KDD ’09, Paris, France, 2009, p. 1105. doi: 10.1145/1557019.1557139.