

In 2020, as the months-long novel coronavirus epidemic rages around the world, researchers worldwide are fighting hard in the hopes of gradually understanding the mystery of the virus through the most advanced technology available. In April, researchers from MSR Asia built a COVID-19 analysis website called COVID Insights (covid.msra.cn) based on their professional knowledge and research experience in computational biology and data analysis, among other areas. This website is for academic research and knowledge proliferation purposes. It seeks to help analyze data related to COVID-19 from multiple angles and in a more in-depth manner.
As the circumstances of the pandemic continues to change, the COVID Insights website is also constantly being updated. In June and August of this year, the website has undergone centralized development and launching of new functions to provide continuous support in the fight against the virus.
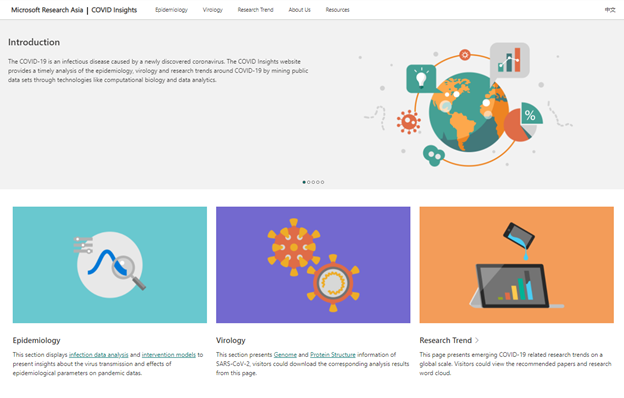
Currently, the COVID Insights website mainly consists of three major sections: Epidemiology,
Virology, and Research Trends. It visually and interactively displays the propagation characteristics of the virus in different countries and regions, the virology analysis results of the virus behind the pandemic—SARS-CoV-2—and the latest global research focuses concerning the pandemic.
All data used on the website are taken from reports officially released by Johns Hopkins University, the US Centers for Disease Control and Prevention, GISAID, and other such organizations. Based on these public data, researchers use advanced technology to discover hidden patterns and insights behind the pandemic, providing a valuable reference to further expand thinking on the pandemic.
The Epidemiology Section
The Epidemiology section aims to help users understand the transmission characteristics of the virus and the impact of common epidemic parameters on virus transmission data by presenting infection data analysis (opens in new tab) and intervention models (opens in new tab).
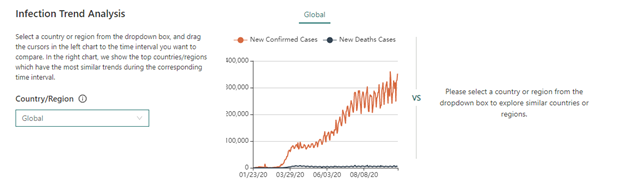
In this section, the infection data analysis page shows a comparison of transmission dynamics across countries and regions through in-depth analysis of COVID-19 data. Here, researchers express the time series data on COVID-19 in low-dimensional Euclidean space. For a given region and time segment, a vector is used in this space to reflect its data trend, which would make it possible to effectively identify which countries or regions have had similar data development during certain time periods and thereby find suitable references.
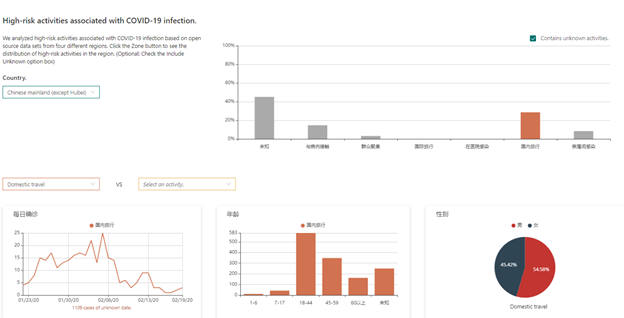
In addition, the High-Risk Activities component of this page provides a unified perspective of analysis based on open source data from four countries/regions. Users can learn about the differences in the main high-risk activities causing the spread of the pandemic in various countries, and can also view and compare fine-grained data.
In order to help people better understand the severity and trends of the pandemic in different regions and to conduct in-depth studies of the genetic variation of the novel coronavirus, the COVID Insights website, in August, added an effective reproduction number (Rt) visualization function and a time series display function for genome analysis results on the infection data analysis page.
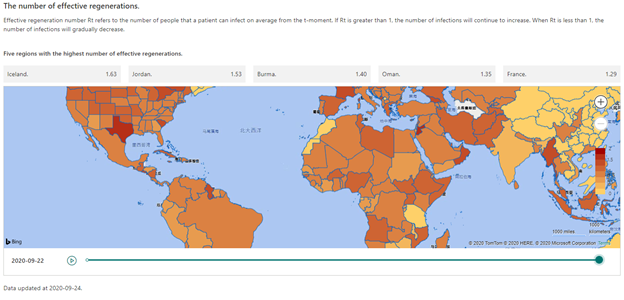
By visualizing the Rt values in different regions, users can intuitively understand the severity and trends of the pandemic in various regions from a heat map. The calculation method of the Rt has been continuously improved over the years. While updating the COVID Insights website, researchers used an open source model(https://github.com/epiforecasts/covid)to calculate the Rt value. When calculating the Rt value of a particular day, researchers use historical diagnosis data based on dynamic windows to obtain more stable and reliable estimates. Taking into account potential misses and errors in the data (for example if the number of confirmed cases is negative), researchers smoothed the number of confirmed cases on a certain day by using the confirmed data in the dynamic window, effectively alleviating the impact of data errors.
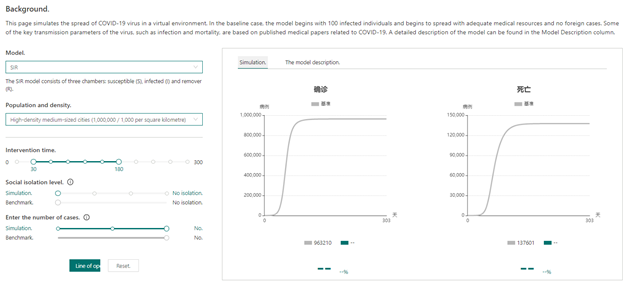
The intervention modeling page of the Epidemiology section uses public epidemiological models to simulate the results of interventions on the spread of COVID-19. Users can adjust the intensity of the intervention measure, the strength of medical capabilities, and other such parameters to observe their impact on virus transmission data and better understand the reasons and driving factors behind virus transmission.
In the simulation of pandemic data, researchers used the classic epidemiological models SIR, SEIR, and SEIR-H. Based on the simulation results of the models, users can understand the impact of various methods of intervention and differing medical capabilities on the data trends. This is especially valuable for areas where the pandemic is developing rapidly.
The Virology Section
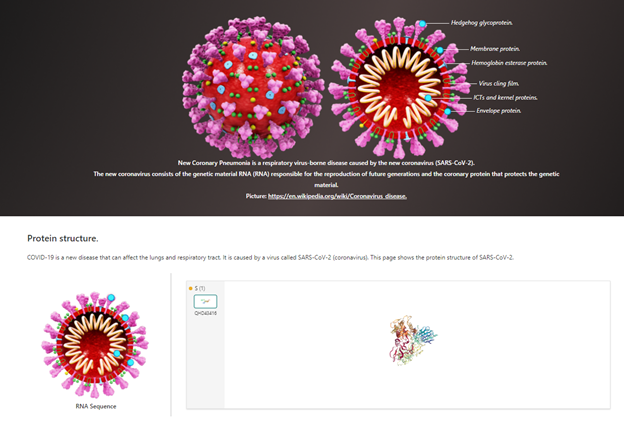
The Virology section of the COVID Insights website includes a page on protein structure and a page on genome analysis. COVID-19 is caused by a virus called SARS-CoV-2 (coronavirus), and the protein structure of this virus is shown on the protein structure page of the website.
The genome analysis page displays the latest information and analysis of SARS-CoV-2 relating to its genome. It also includes information on the RNA sequence of the novel coronavirus. Users can interactively adjust the RNA fragments to focus on and explore detailed information on the mutant amino acids in the sequence. After selecting the type of amino acid and a specific time period, the user can view the corresponding sequence of the amino acid at the current position in each continent, its quantity and proportion in all sequences on that continent, and its trend of change during that timeframe.

In addition, users can also view genome comparisons and analyses between SARS-CoV-2 and several other coronaviruses including SARS, MERS, etc., to understand the similarities and differences between them.

The Research Trends Section
The Research Trends section uses visualization to present popular papers and trending topics related to the novel coronavirus from the perspective of multiple disciplines. Users can select any time period to view the most popular keyword word cloud and the most cited papers from that time period. At the same time, if a user clicks on any keyword in the word cloud, he/she would be able to see a list of the most cited papers related to that keyword. To the right of the word cloud, a new function on recommended papers has been added. Here, the website recommends high-quality papers for users based on various factors such as the level of attention that has been given to them, their authoritativeness, and the hot topics that are covered.

In summary, the Epidemiology section contains infection data analysis and intervention models, the Virology section contains genome analysis and protein structure information, and the Research Trends section presents global research trends related to COVID-19, using a two-level structure to help users find the function they need with speed and clarity. Currently, thanks to the continuous effort of the research team, these three core sections have improved in maturity, providing users with references to scientifically understand the epidemic data.
Everyone is welcome to use the COVID Insights website! We also hope to empower more researchers interested in analyzing COVID-19 data and contribute to the fight against the pandemic.