

Key takeaways:
- A/B tests are a powerful tool for rolling out infrastructure and backend changes in a controlled way, uncovering surprises and important issues that other testing approaches may miss.
- A little data can go a long way. With Variance Reduction enabled, A/B testing internal-facing services with modest traffic can still generate trustworthy stat-sig results and enable data-driven ship decisions.
- Focusing on back-end specific metrics such as individual API call latency is insufficient. Product-wide guardrail metrics are needed to see the full impact of infra changes to user experience.
- Even mature product data pipelines and metric definitions can harbor bugs. Validate and improve the telemetry and metrics used for running your infrastructure A/B tests.
- Plan for multiple iterations of Infra A/B tests, learn more about your product and users from every iteration, and use those learnings to refine your design.
Introduction
The Experimentation Platform at Microsoft (ExP) has evolved over the past sixteen-plus years and now runs thousands of online A/B tests across most major Microsoft products every month. Throughout this time, we have seen impactful A/B tests on a huge spectrum of changes, everything from large product overhauls to the smallest bug fixes.
ExP infrastructure had to evolve and scale significantly over time to meet the needs of our users and the requirements of advanced methodologies that the team pioneered [1], [2]. In the most recent phase we’ve made ExP infrastructure more secure, resilient and available across multiple Azure geographies – features expected by product teams both inside and outside Microsoft.
Making major changes to infrastructure can be risky, but A/B experiments are an excellent tool to mitigate that risk and understand the causal effects of the changes being made. A frequent misconception is that A/B experiments are only suited for front-end or user-facing changes, but we will demonstrate how we leveraged our own A/B testing platform for rolling out extensive infrastructure changes in a controlled manner. We’ll share the lessons learned to help other teams use A/B experimentation for their own infra deployments!
The desired state
Our system started with a relatively simple n-tier architecture: a web UI that interacts with a set of backend API services that connect to a database. The following figure illustrates an example of this architecture:

Figure 1. Initial state.
As noted earlier, the end goal was to scale-out the platform to multiple regions and this also presented a great opportunity to harden the API surface and modernize some of the underlying infrastructure. In practice that meant sending all API requests through Azure FrontDoor, which adds DDoS and firewall protections, then isolating all backend resources from direct internet traffic. Our system includes a reverse-proxy layer which agglomerates the numerous backend services into one Experimentation Platform API which the users interact with and this reverse proxy layer was key for orchestrating A/B tests in the later stages of the process.

Figure 2. Desired state.
A/B Tests Designs
We wanted to assure that our architecture changes did not affect the performance or reliability of the system in a negative way. To do this, we used A/B testing to compare the old and new architectures and see how they influenced key metrics such as latency, throughput, availability, and error rate. We divided our work into two major A/B tests to roll out the changes gradually and measure the effects precisely:
- The first test measured the impact of adding new routing and networking layers into the system, we anticipated some performance degradation in the treatment variant and needed to quantify it. Treatment variant traffic would pass through additional layers while control variant traffic took the existing simpler path.
- The second test measured the difference between the existing “serverless” infrastructure (control variant) and equivalent services hosted on an App Service Environment inside a virtual network (treatment variant) – we did not expect this change to cause significant difference.
From an engineering perspective it might seem easier to ship the whole set of changes as a single release, however since we have two distinct hypotheses each should be tested independently. This methodical approach paid off by providing us with better insight when things did not go as planned, as you will in the results & learning section.
First A/B Test: Routing requests through Reverse Proxy
In the first A/B test, we evaluated the impact of introducing additional routing layers into the system – the requests in the treatment variant were now processed by Azure FrontDoor, Web Application Firewall, and a reverse-proxy before being processed by the application service. In addition to rewriting URLs to make them aligned with URL patterns, the new reverse-proxy enables us to route traffic based on variant assignments – which we did in the second A/B test. The hypothesis for this first A/B test was that we will observe an acceptably small increase in page load metrics and API latency due, to the new functionality and features in the networking stack. Measuring duration of individual API requests is simple but that may not capture the true impact on users’ experience – websites typically make multiple calls to the back-end APIs, sometime sequentially, and a small regression in API latency may cause a much more severe regression in overall user experience. Therefore, it was imperative to know how a change like this will impact on the overall user experience.
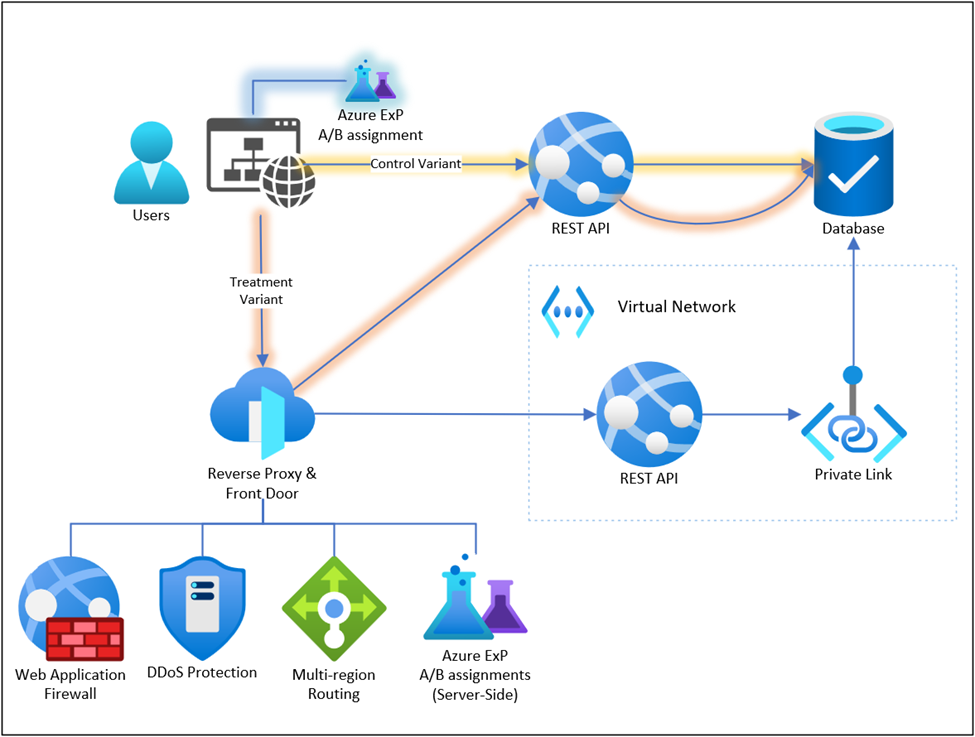
Figure 3. First A/B Test: Routing requests through Reverse Proxy.
First A/B Test: Results & Learnings
We anticipated a regression of 30-40ms per API request (about 5-10% for most calls). Weighing the tradeoffs between the API client workloads, the security improvements, the added functionality, improved observability, the internal-facing nature of these APIs – the team deemed this to be acceptable.
In this first iteration Azure FrontDoor was communicating with our backend App Service via private links, this configuration is simple and elegant but, in some cases, results in cross-datacenter routing since Azure FrontDoor only supports private links in a limited set of regions [5] (opens in new tab). We knew of this potential inefficiency but overall did not expect it to be significant. However, the initial A/B scorecard showed that on some frontend components the treatment group saw a severe degradation in “main functionality load” metrics (the time between the user landing on a page and seeing something useful on the screen) where in some cases it doubled! An in-depth investigation by the engineering team revealed that the minor API latency increase was amplified by (1) the UI code making certain requests sequentially, and (2) calls requiring CORS preflight requests [3] (opens in new tab) could double the network overhead. Without an A/B scorecard the unanticipated impact could have been easily missed, some of the components receive relatively little traffic and drastic changes in daily metric values can be easily dismissed as an outlier or high variance.
For the next iteration we replaced private links with App Gateways to optimize the network paths. After addressing the unexpected latencies, we obtained an acceptable result and we shipped the treatment variant to 100%.
With a clear understanding of the trade-off made by introducing an additional networking layer, we were now ready to confidently evaluate the next phase of our infrastructure changes.
Second A/B Test: Routing requests to different backend services
The second A/B test was conducted within the Reverse Proxy with the goal to evaluate the impact of hosting backend services inside a private virtual network which we did to align with best practices for system architecture and security [4] (opens in new tab). We used the reverse-proxy component introduced in the first A/B test to split API traffic between the existing publicly accessible application service instance (control) and the new hosted app service inside the virtual network (treatment). The hypothesis was that there would be no significant difference between the two variants in terms of performance and product experience (e.g. no increase in error rates).
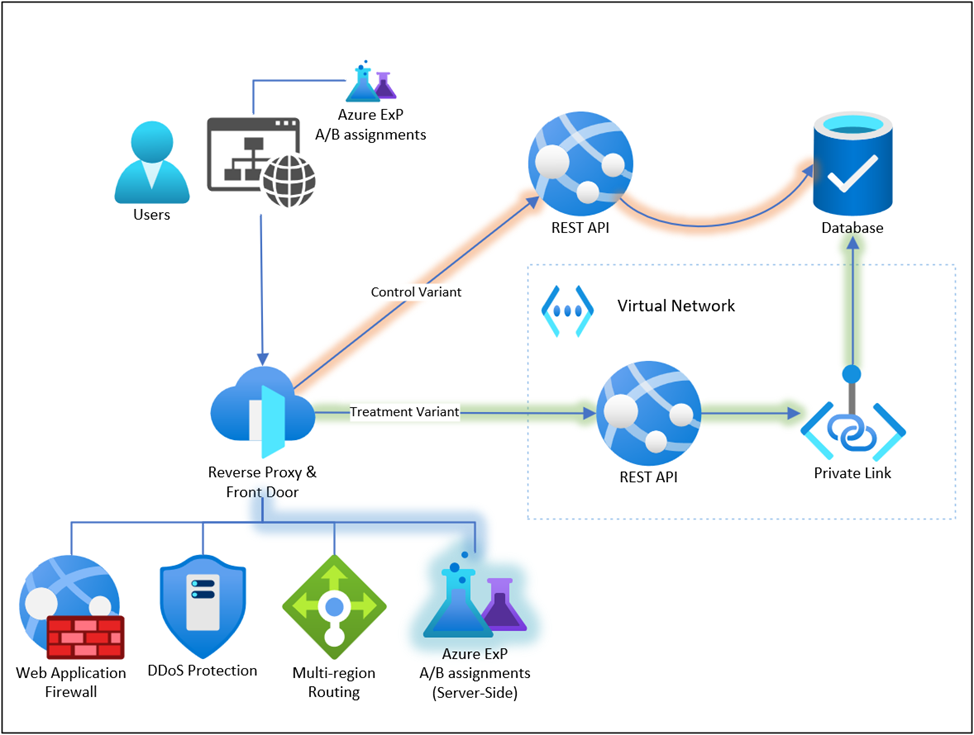
Figure 4. Second A/B Test: Routing requests to different backends
Second A/B Test: Results & Learnings
We ended up going through more than 10 iterations of this A/B test:
- Several bugs had to be fixed, code redeployed, which meant running the A/B test again.
- We leveraged feature flags to quickly rollback bad deployments, in some cases before an A/B scorecard was even generated.
- A/B scorecards helped identify subtle performance differences in the new infrastructure.
- Early iterations revealed new gaps in telemetry, some backend and frontend events did not correlate well limiting the usefulness of early A/B scorecards.
- Telemetry pipelines need to evolve in parallel with the rest of the system, sometimes that means re-running the A/B test to collect new data.
In one iteration we discovered a redundant API call in the treatment variant (the instance deployed inside the virtual network). The regression was introduced when we modified the service startup code to run in the new isolated environment. This change did not cause any correctness issues and sailed through the automated test suites. Applying feature flags to service startup code or runtime parameters is generally difficult and often impossible, in order to A/B test changes like these the A/B split must happen earlier and the reverse proxy plays that key role by routing traffic based on the assigned variant.
In another iteration, we discovered a difference in the SQL connection configuration. The treatment instances connected to the Azure SQL database through a private link (so we can eventually disable public access to the SQL server) and the default network configuration caused SQL connections to regress from using “redirect” to “proxy” mode which incurs some latency and throughput penalty [6] (opens in new tab). The initial phases of the rollout did not show a stat-sig differences in performance metrics, but subsequent phases included endpoints which were much more sensitive to latency and those results clearly showed a statistically significant difference in performance metrics. The result from the later scorecard came as a surprise because we thought this part of the infrastructure was already vetted with the initial set of endpoints. Leveraging our A/B analysis allowed us to identify this surprise before it created problems in the migration.
In most iterations the A/B analysis proved essential for obtaining trustworthy results and making objective “ship” decisions, otherwise several regressions could easily have gone undetected if relying solely on health counters and anomaly detection. There were also cases where the impact from the changes was severe enough that we did not need to wait for an A/B scorecard with fine-tuned metrics and p-values – it was apparent from basic alerts and health counters. The problems stemming from authentication credentials and authorization used by production resources are especially difficult to vet ahead of time because of the unique nature of credentials and authorization between environments. However controlling traffic via feature flags (exposure control) enabled us to quickly and precisely mitigate the problem by stopping the A/B test and reverting all traffic back to the control variant.
Summary
Ultimately, by leveraging A/B tests for our infrastructure changes, we were able to quickly identify and iterate on several unexpected metric changes that were easily identified from the A/B test results. Anytime we detected a regression, we were able to stop the exposure in seconds and start iterating on the variant. We still had to make trade-offs, but we were able to clearly articulate these trade-offs with quantifiable numbers. And in several iterations, we were able to investigate, adjust and verify to ensure that the metrics aligned with our expectations and requirements.
– Serguei Michtchenko, Heng-Yi Liu, Caleb Hug, Aleksander Fabijan, Craig Boucher, Microsoft Experimentation Platform
Special thanks to Dhanushi Wijeyakulasuriya, Yanshu Zhu, Michael Cherkasov, Anshuman Vyas, Elvis Tran, Ramesh Boddu, Sashank Kolli, Wenli Li, Benjamin Arai, Jen Townsend, and the rest of the ExP team for their contributions and involvement in this work!
References
- https://www.microsoft.com/en-us/research/group/experimentation-platform-exp/articles/deep-dive-into-variance-reduction
- https://www.microsoft.com/en-us/research/group/experimentation-platform-exp/articles/alerting-in-microsofts-experimentation-platform-exp/
- https://developer.mozilla.org/en-US/docs/Glossary/Preflight_request (opens in new tab)
- https://learn.microsoft.com/en-us/azure/security/fundamentals/network-best-practices (opens in new tab)
- https://learn.microsoft.com/en-us/azure/frontdoor/private-link (opens in new tab)
- https://learn.microsoft.com/en-us/azure/azure-sql/database/private-endpoint-overview?view=azuresql#use-redirect-connection-policy-with-private-endpoints (opens in new tab)