Human-computer interaction
Redefining human experiences through innovations in research, design, and technology.


Video
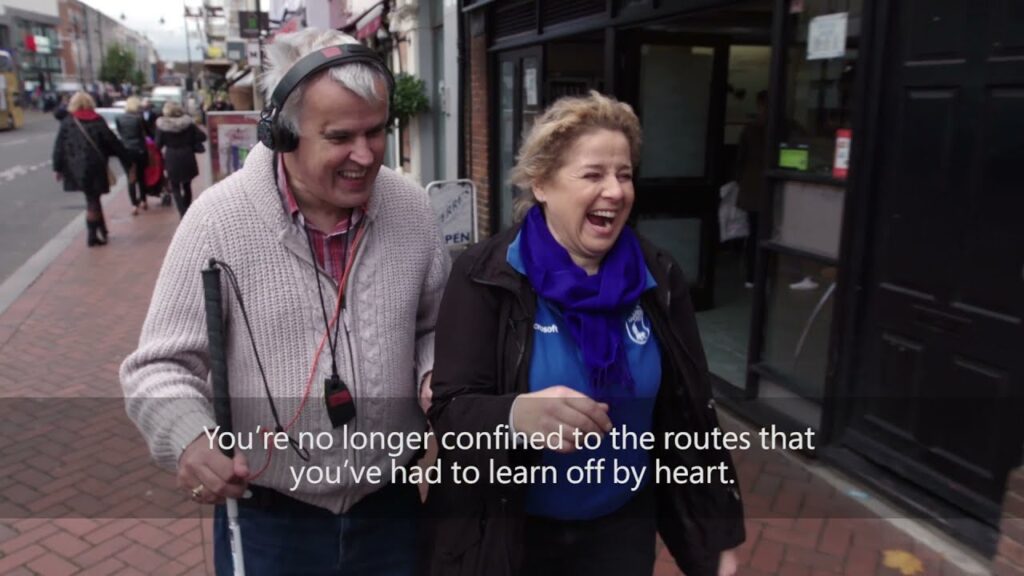
Microsoft Soundscape – Lighting up the World with Sound
Inspired by fatherhood, Amos corralled a group of people at the Guide Dogs for the Blind and Microsoft and together they set out on a quest to reimagine independence and mobility of blind people with…
Video
The Journey to Microsoft Soundscape
Cities Unlocked is a unique collaboration between Guide Dogs UK and Microsoft, which explores the potential technology has to enable people living with sight loss to get out and about, independently and confidently, in our…
Video
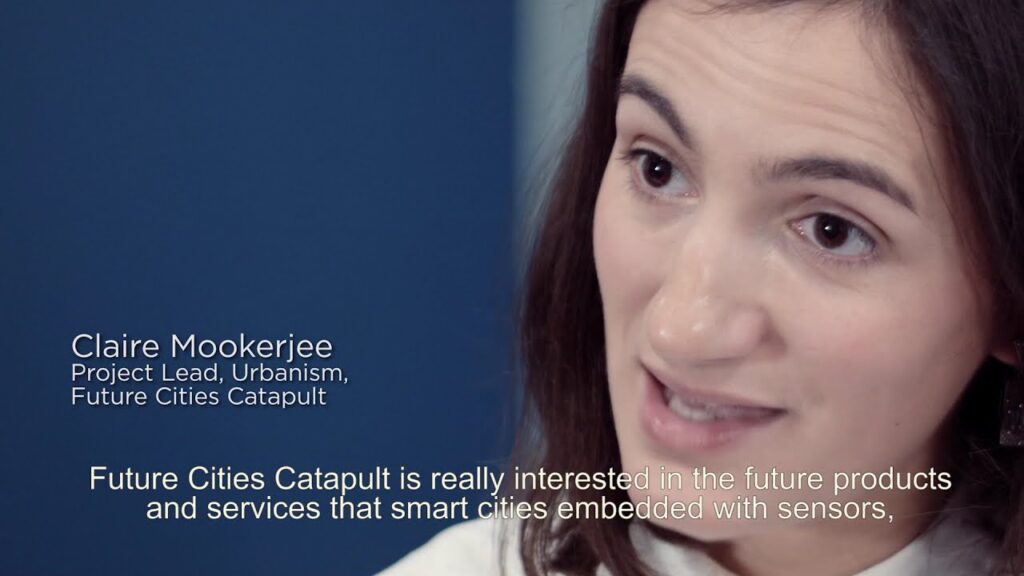
Cities Unlocked – Introducing 3D Sound for Greater Mobility and Independence
Microsoft, Guide Dogs UK, and Future Cities Catapult launch the results of the first phase of an exciting project which will revolutionize how people with sight loss, and the sighted, experience the urban landscape, by…
Microsoft Research Blog
CHI 2021: Making remote and hybrid meetings work in the new future of work
Over the course of the COVID-19 pandemic, some truths about the nature of work have been underscored: it is uniquely complex, quickly shifting, and increasingly technology-mediated. Teaching, medicine, mental health, and other professions—previously thought to…
Video
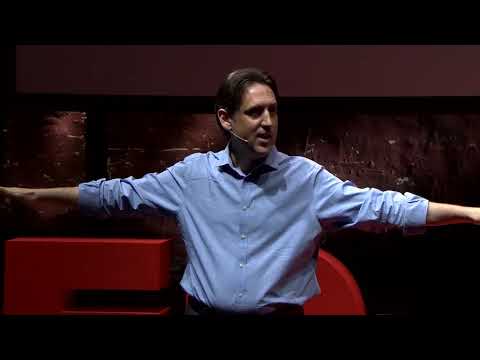
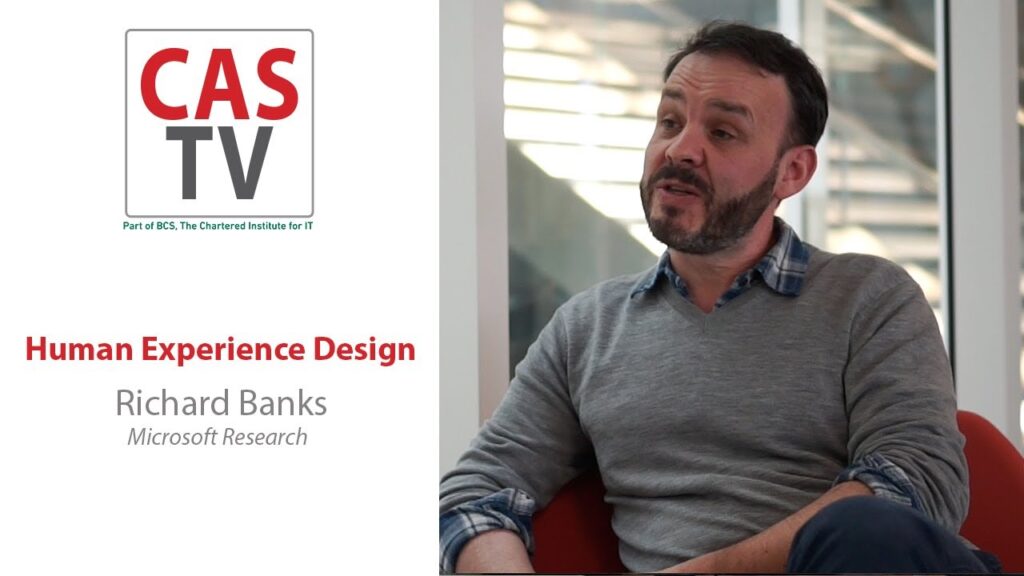
Richard Banks – Human Experience Design
This week on CAS TV, we hear from Richard Banks, principal design manager at Microsoft Research Cambridge, about the place and process of human experience design in the technological development process. In his role of…
Video
Platform for Situated Intelligence Workshop | Day 2
The Platform for Situated Intelligence Workshop took place on April 27-28, 2021. Platform for Situated Intelligence is an open-source framework from Microsoft Research that significantly accelerates development and research on multimodal, integrative-AI applications. This framework…
Video
Platform for Situated Intelligence Workshop | Day 1
The Platform for Situated Intelligence Workshop took place on April 27-28, 2021. Platform for Situated Intelligence is an open-source framework from Microsoft Research that significantly accelerates development and research on multimodal, integrative-AI applications. This framework…
Tool
HAX Playbook
The Human-AI eXperience (HAX) Playbook (opens in new tab) is an interactive tool for generating interaction scenarios to test when designing user-facing AI systems. The Playbook helps you test AI interaction designs before building out…
Microsoft Research Blog
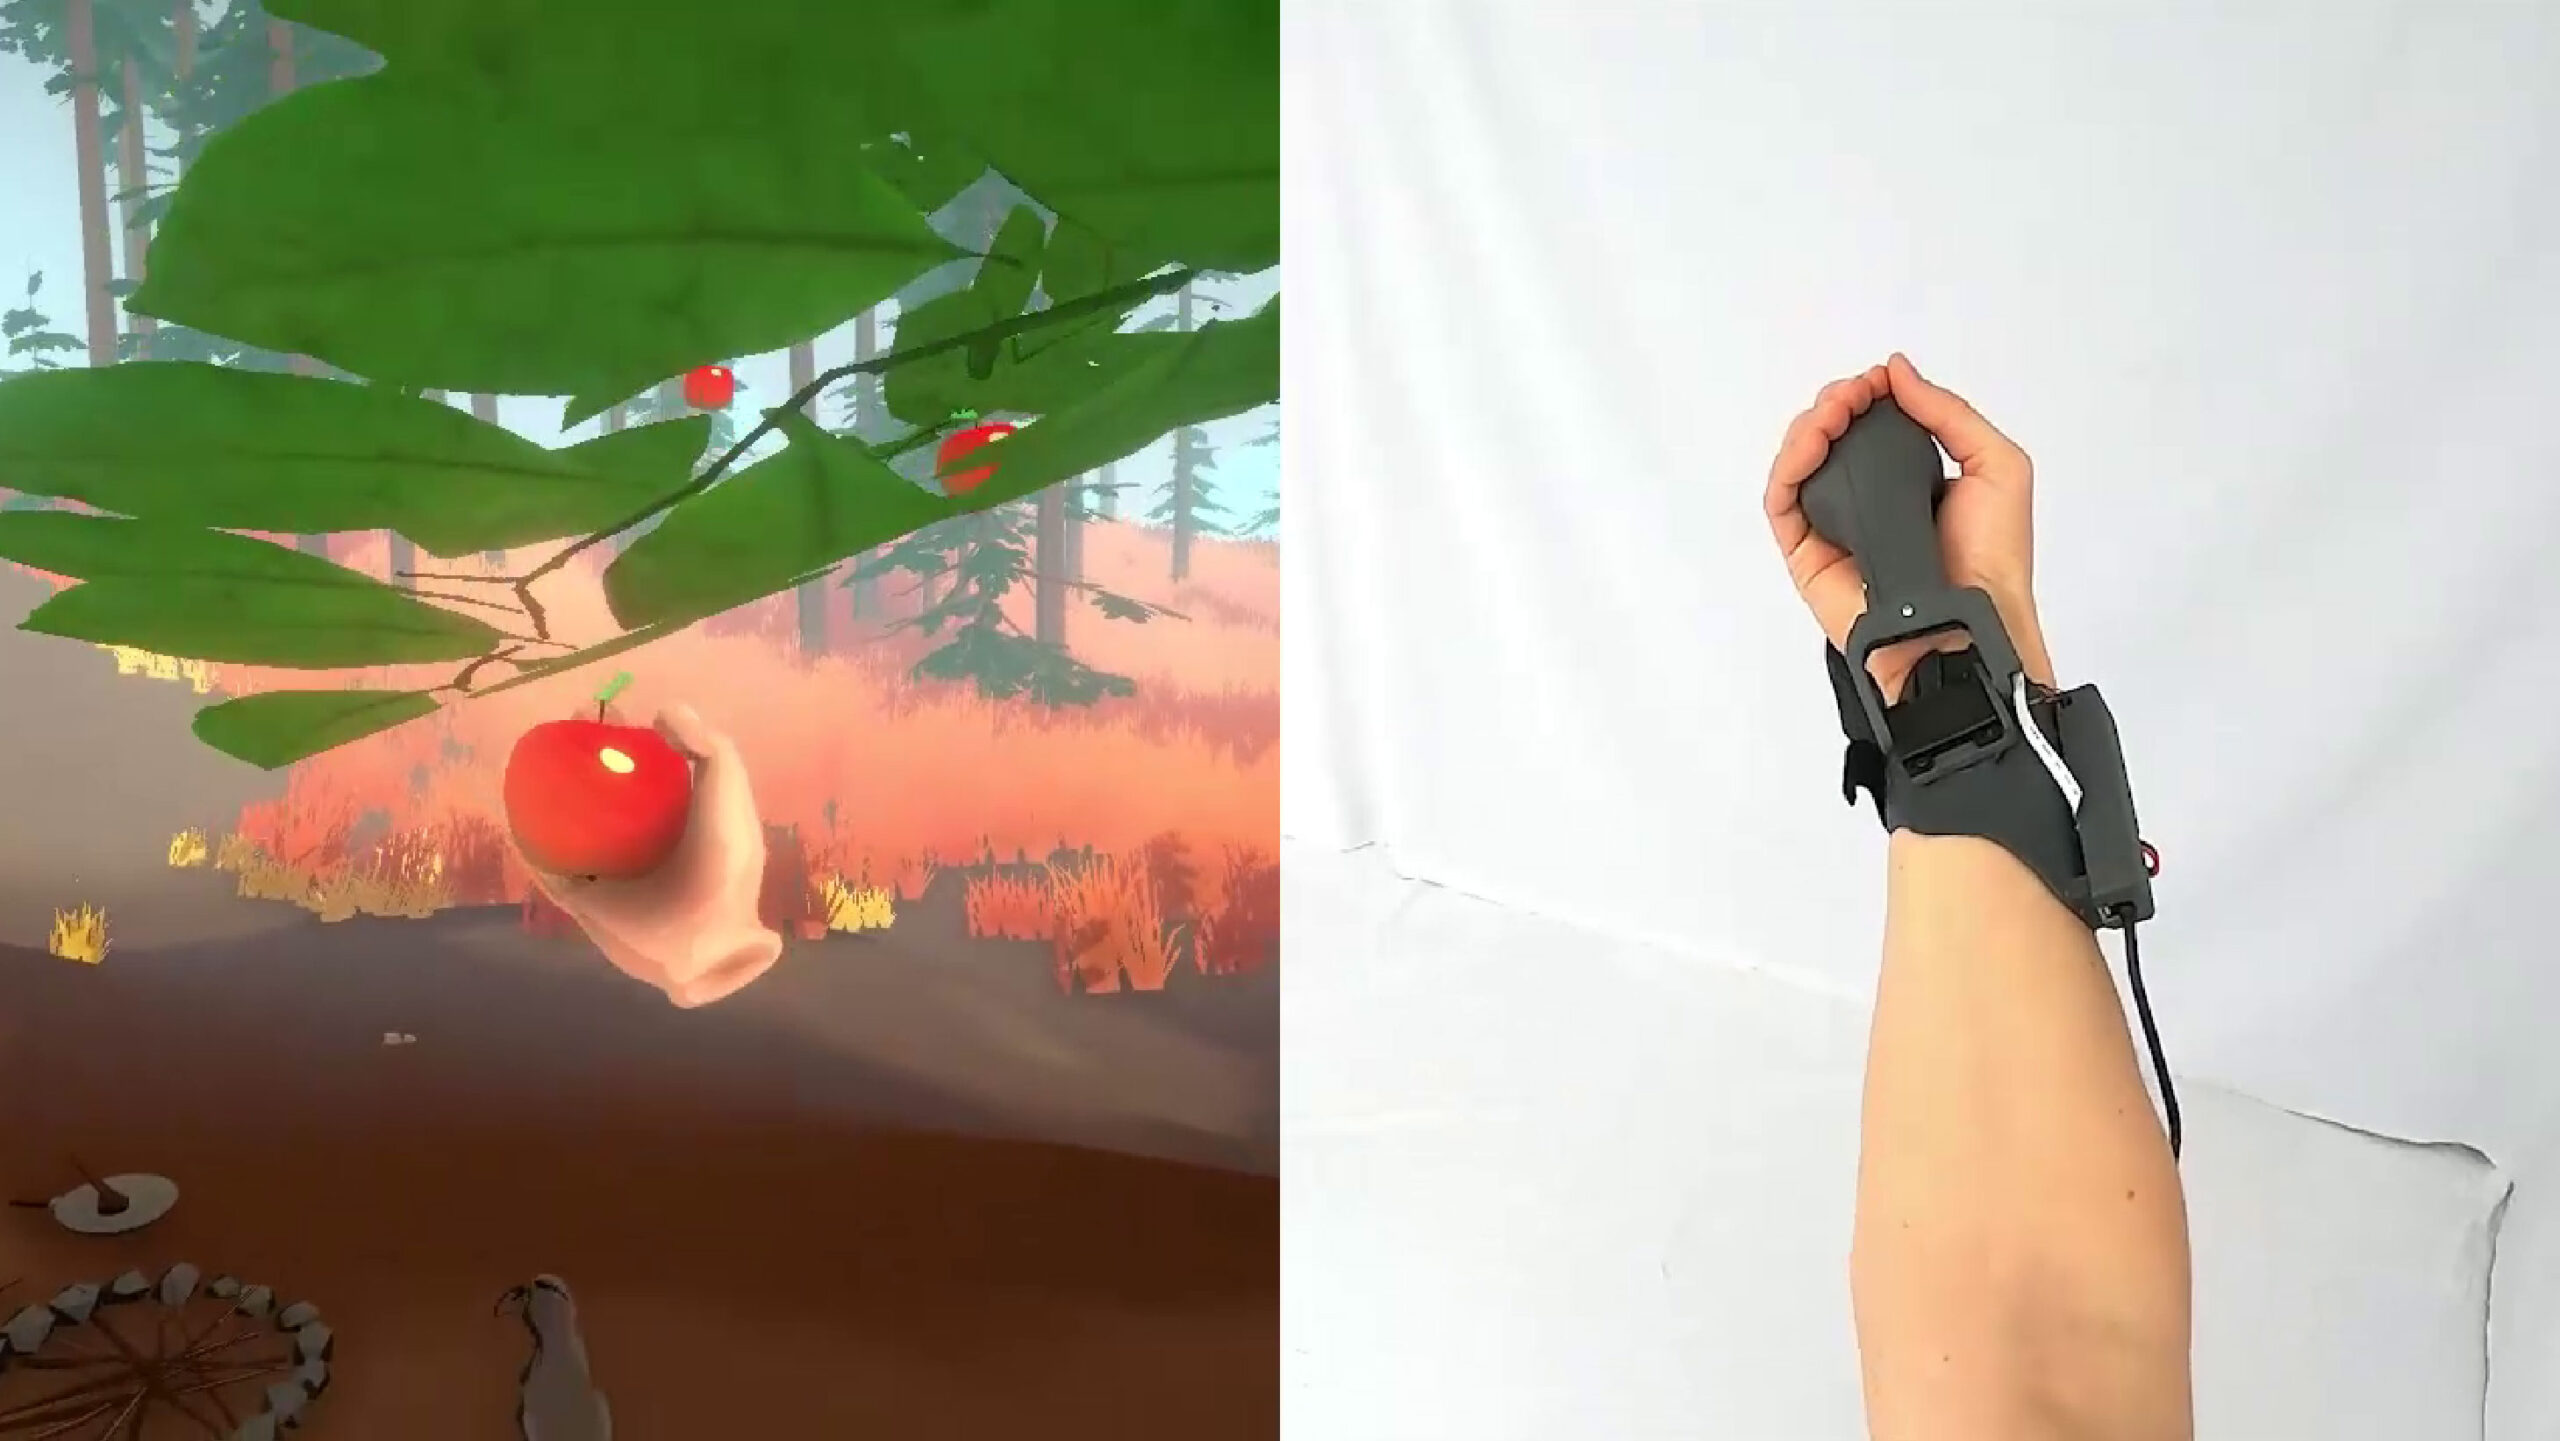
Hands-on research and prototyping for haptics
While many of us think of human-computer interaction as a job for the eyes, ears and mind, we don’t think as often about the importance and complexity of our tactile interactions with computers. Haptics –…